Introduction & Background
When we first deployed NetBox into an enterprise environment, we developed some basic automations to poll the customer network (routers, switches, firewalls, etc.). We then pushed the data into NetBox via the API.
This was ok for mapping fields 1:1, like pulling device serial numbers from a router and pushing into NetBox, however it had many limitations.
- It was very hard to group devices into jobs, i.e. we could use NetBox tags, but this was cumbersome.
- If a discovery script failed, it would have to start again, and there was no status tracking or scheduling.
- When something went wrong, it required manually trawling through logs.
- There was no way to reconcile changes (other than exporting into Excel and sorting the data) with everything just getting pushed straight into NetBox.
Apache Airflow
Introduction
As we started to build out Netos, scheduling and orchestration became a big challenge, that’s taken us a year to solve. We decided that we needed a solution that would:
- Enable us to scale up to hundreds of thousands of queued jobs, with concurrency.
- Provide a full audit trail for every job, with the logs easily accessible.
- Deal with polling errors and system failures (e.g. Airflow or NetBox restarting, connectivity issues, etc.)
- Provide flexibility to deal with any data flow, i.e. starting with Ansible, but later supporting API integrations.
- Provide a framework that was easy and low risk to expand, for example, adding an integration or pipeline.
As you might have guessed from the title of this article, we chose Airflow. From the Airflow website, here is a description of what it does:
Apache Airflow™ is an open-source platform for developing, scheduling, and monitoring batch-oriented workflows. Airflow’s extensible Python framework enables you to build workflows connecting with virtually any technology. A web interface helps manage the state of your workflows. Airflow is deployable in many ways, varying from a single process on your laptop to a distributed setup to support even the biggest workflows.
Polling Flow
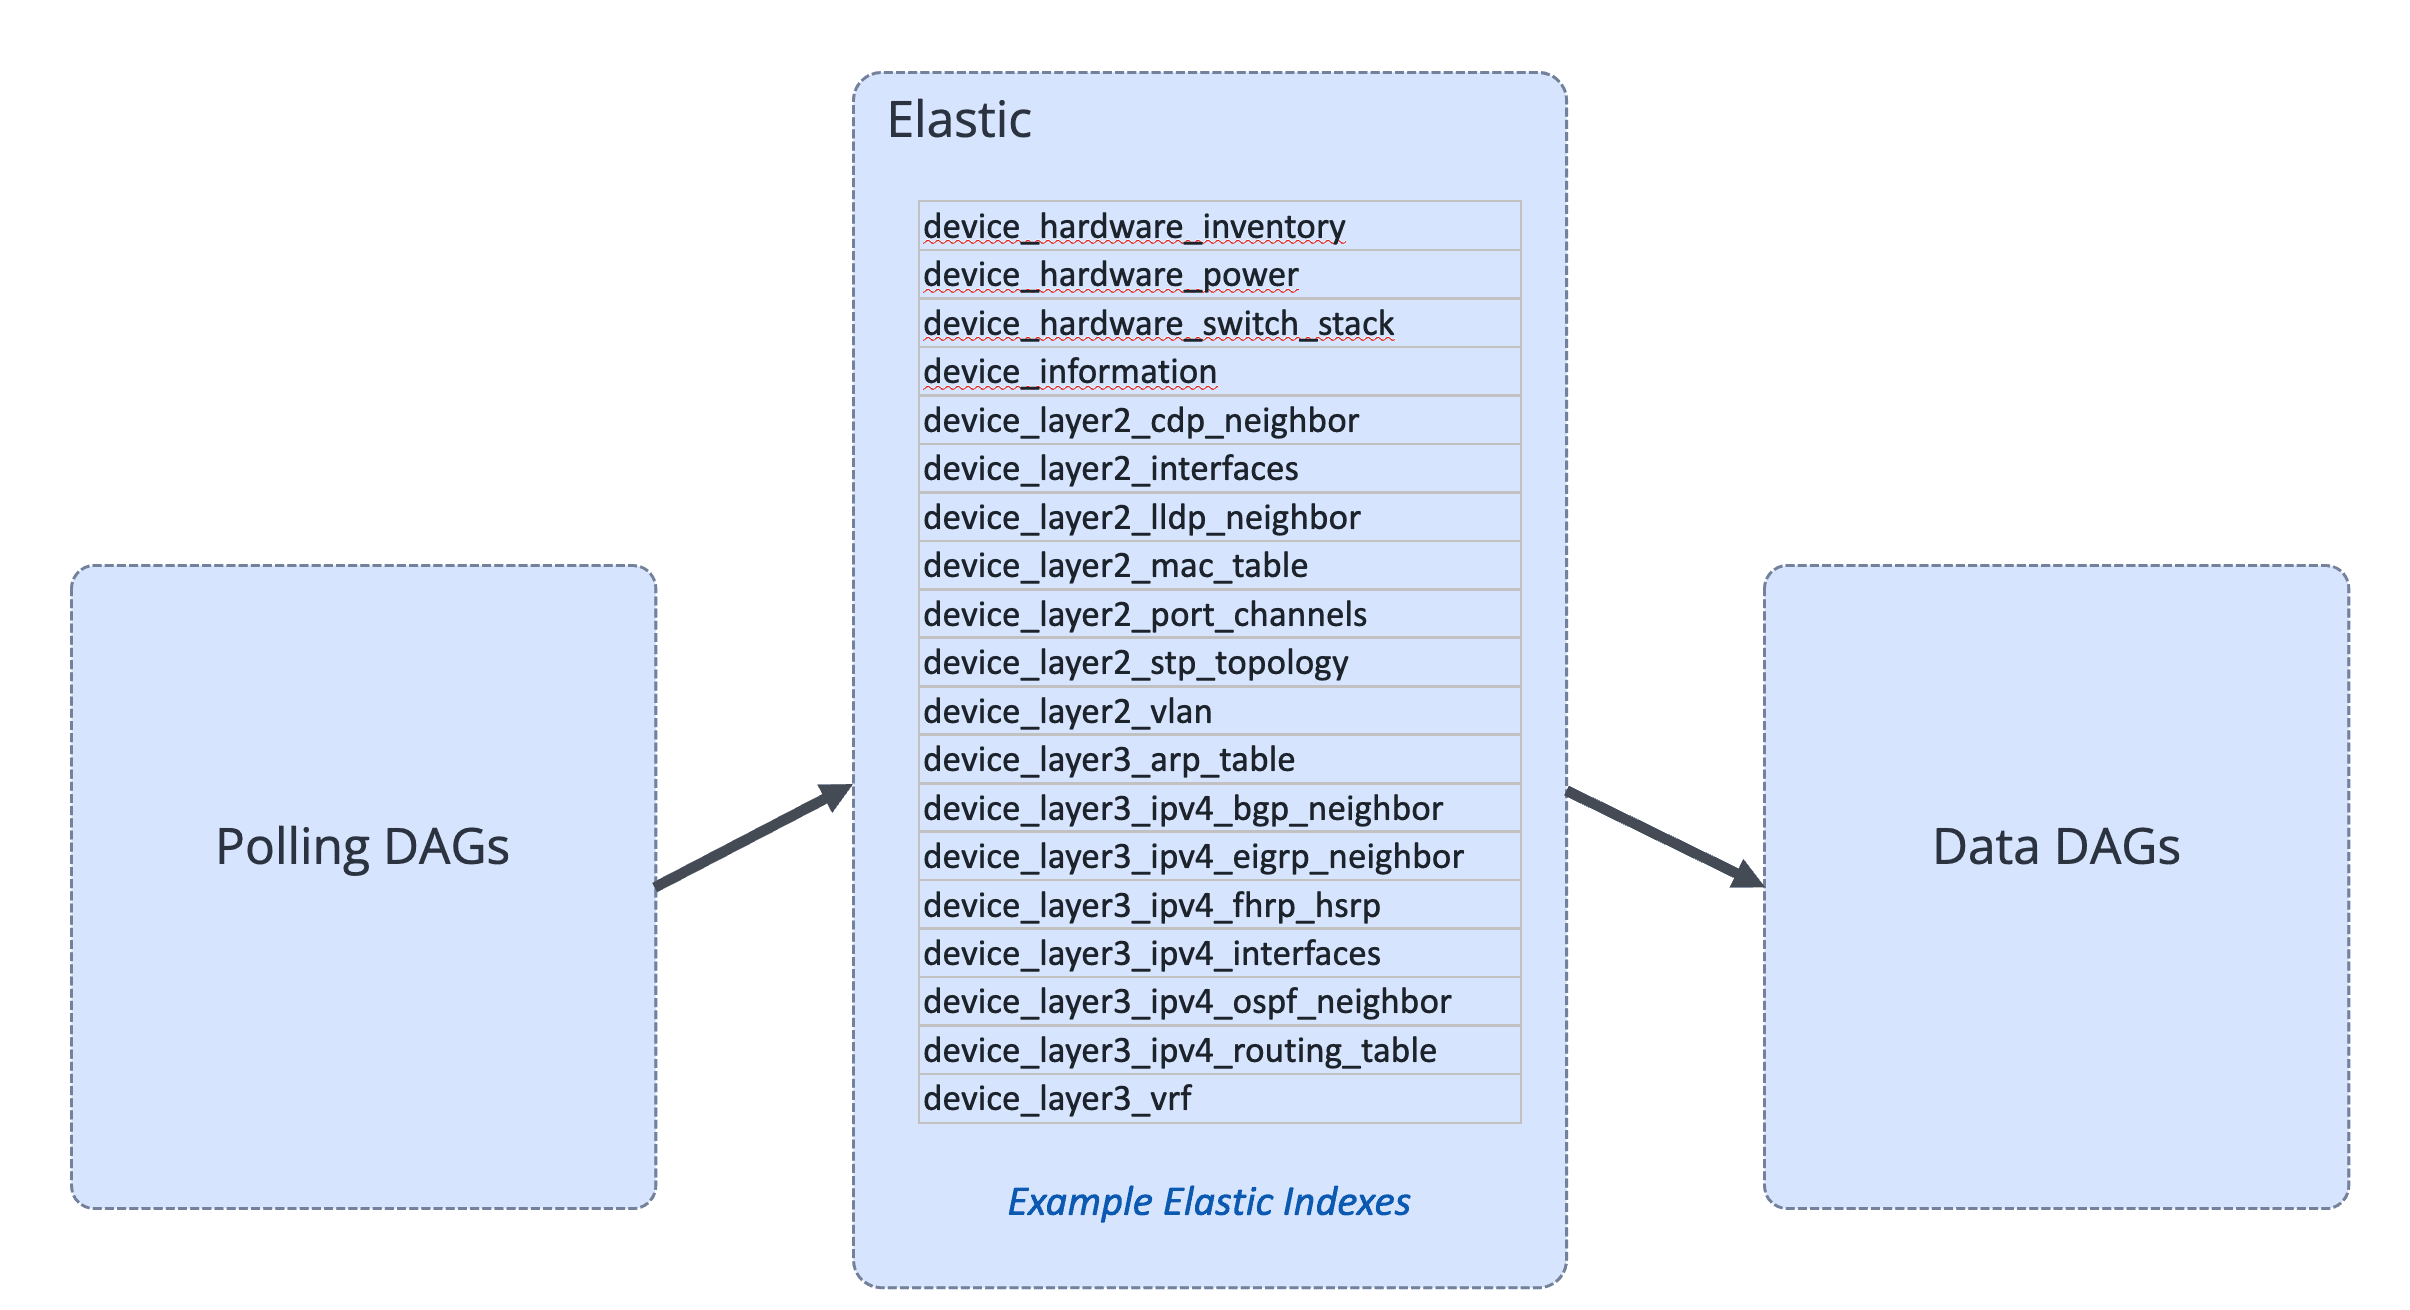
The following diagram provides a very simple view of the polling flow. It’s key to understand that we completely separate the polling logic from the synchronization into NetBox.
A polling job doesn’t push any data into NetBox, it just collects and normalizes the data into a standard schema, and pushes into an Elastic index.
Also, our approach is that the Data DAG code shouldn’t change, so irrespective of the vendor (and future additions) we don’t need to change the complex aspects of the code.
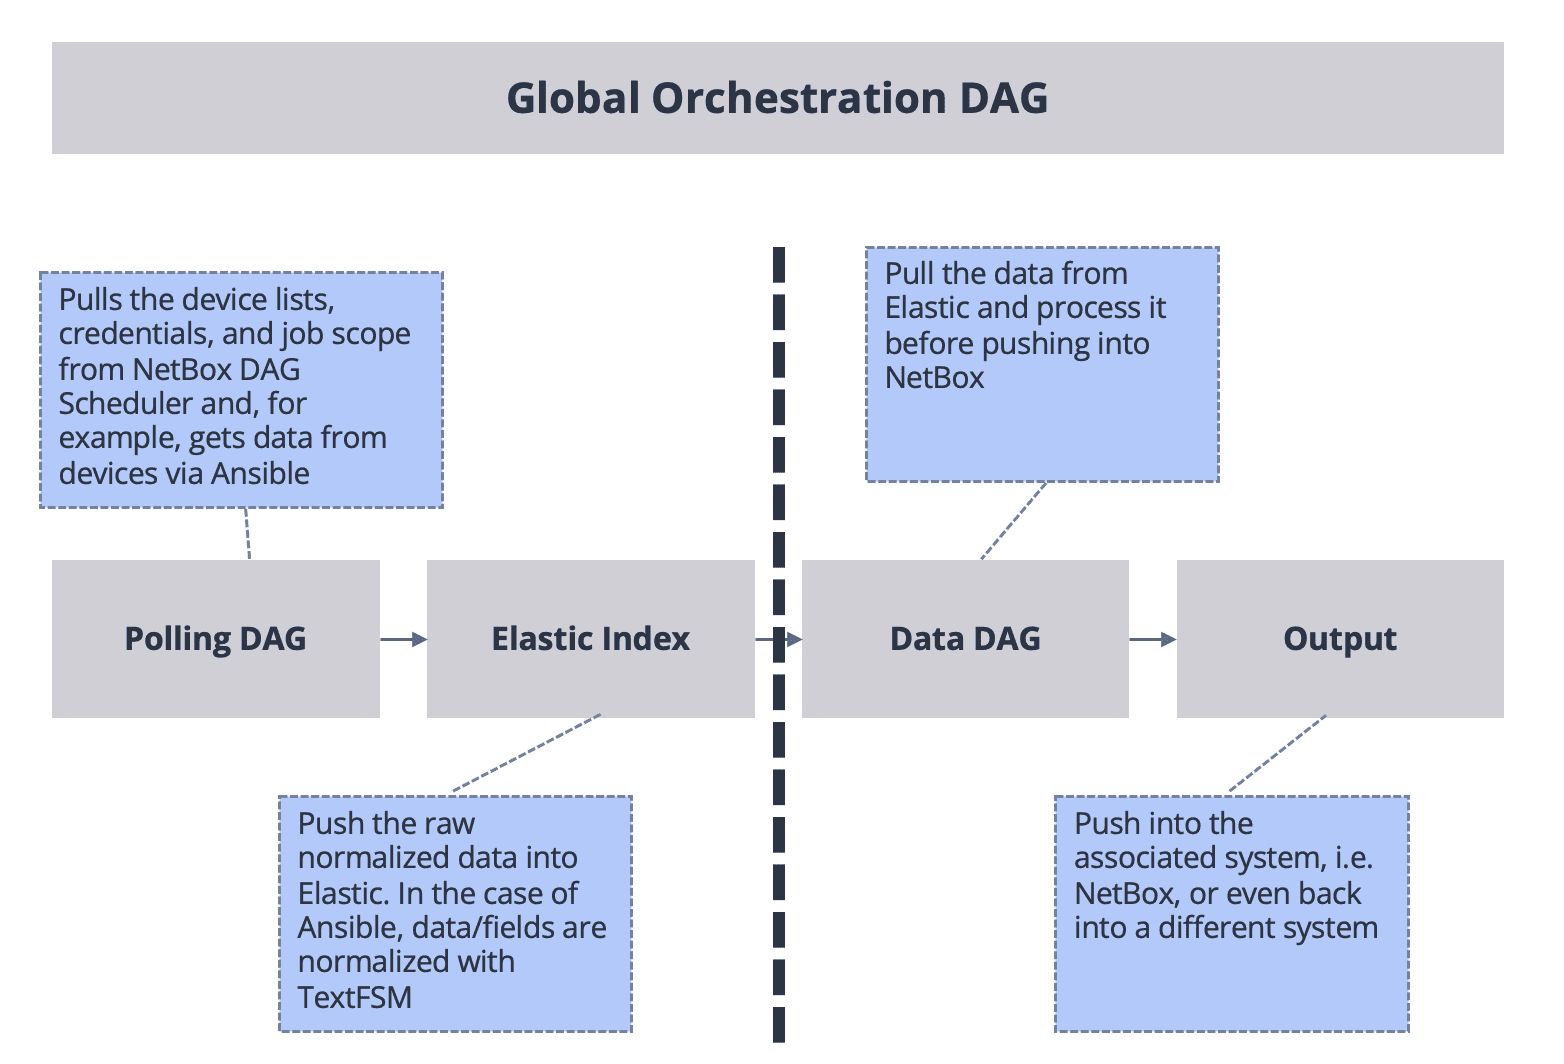
Whilst the diagram above focusses on Ansible and TextFSM to poll and process data from the network, the framework has been designed to support other data collection methods.
For example, pulling data via Cloud APIs (like Meraki), network management systems (like Palo Alto Panorama, SolarWinds), and so on.
This was very important, because we know that every network is different and brings with it a unique set of demands. With the framework we’ve built we can adapt to most user requests, i.e. “pull data from this system, process/ETL it, and push it to NetBox”.
In fact, we use Airflow to sync data feeds (via API) into NetBox.
Airflow for Network Automation
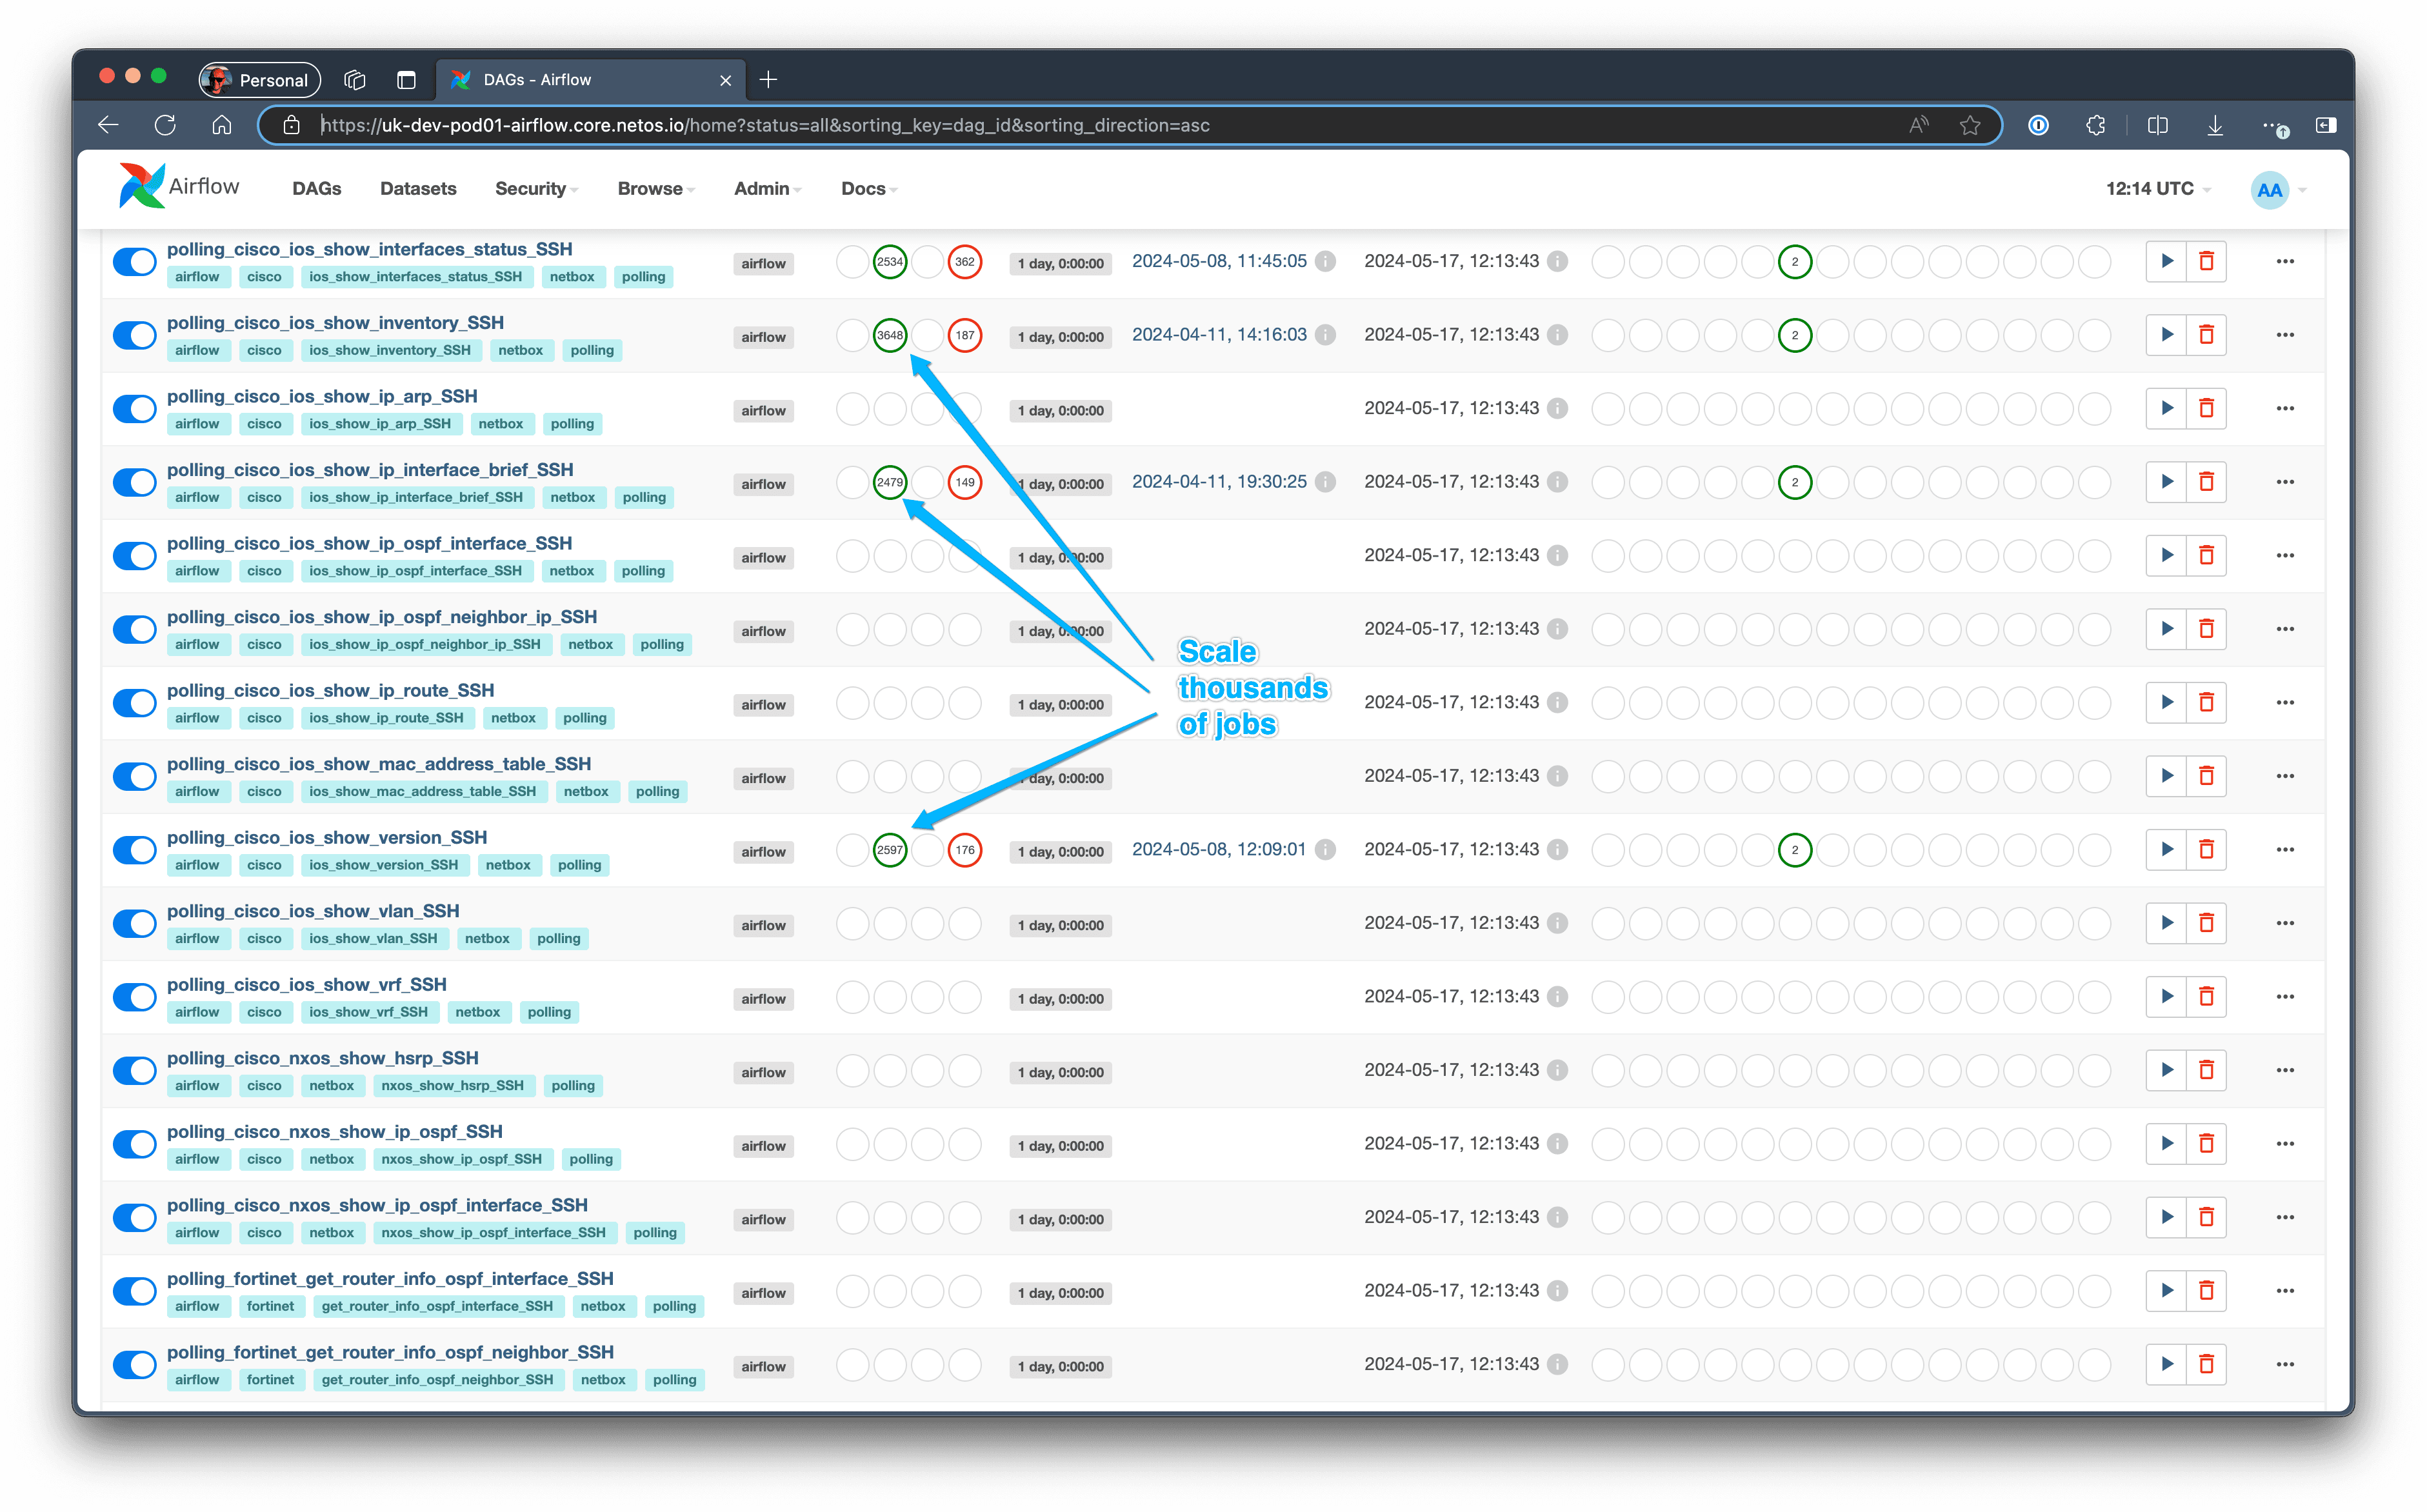
Scale to Thousands of Jobs
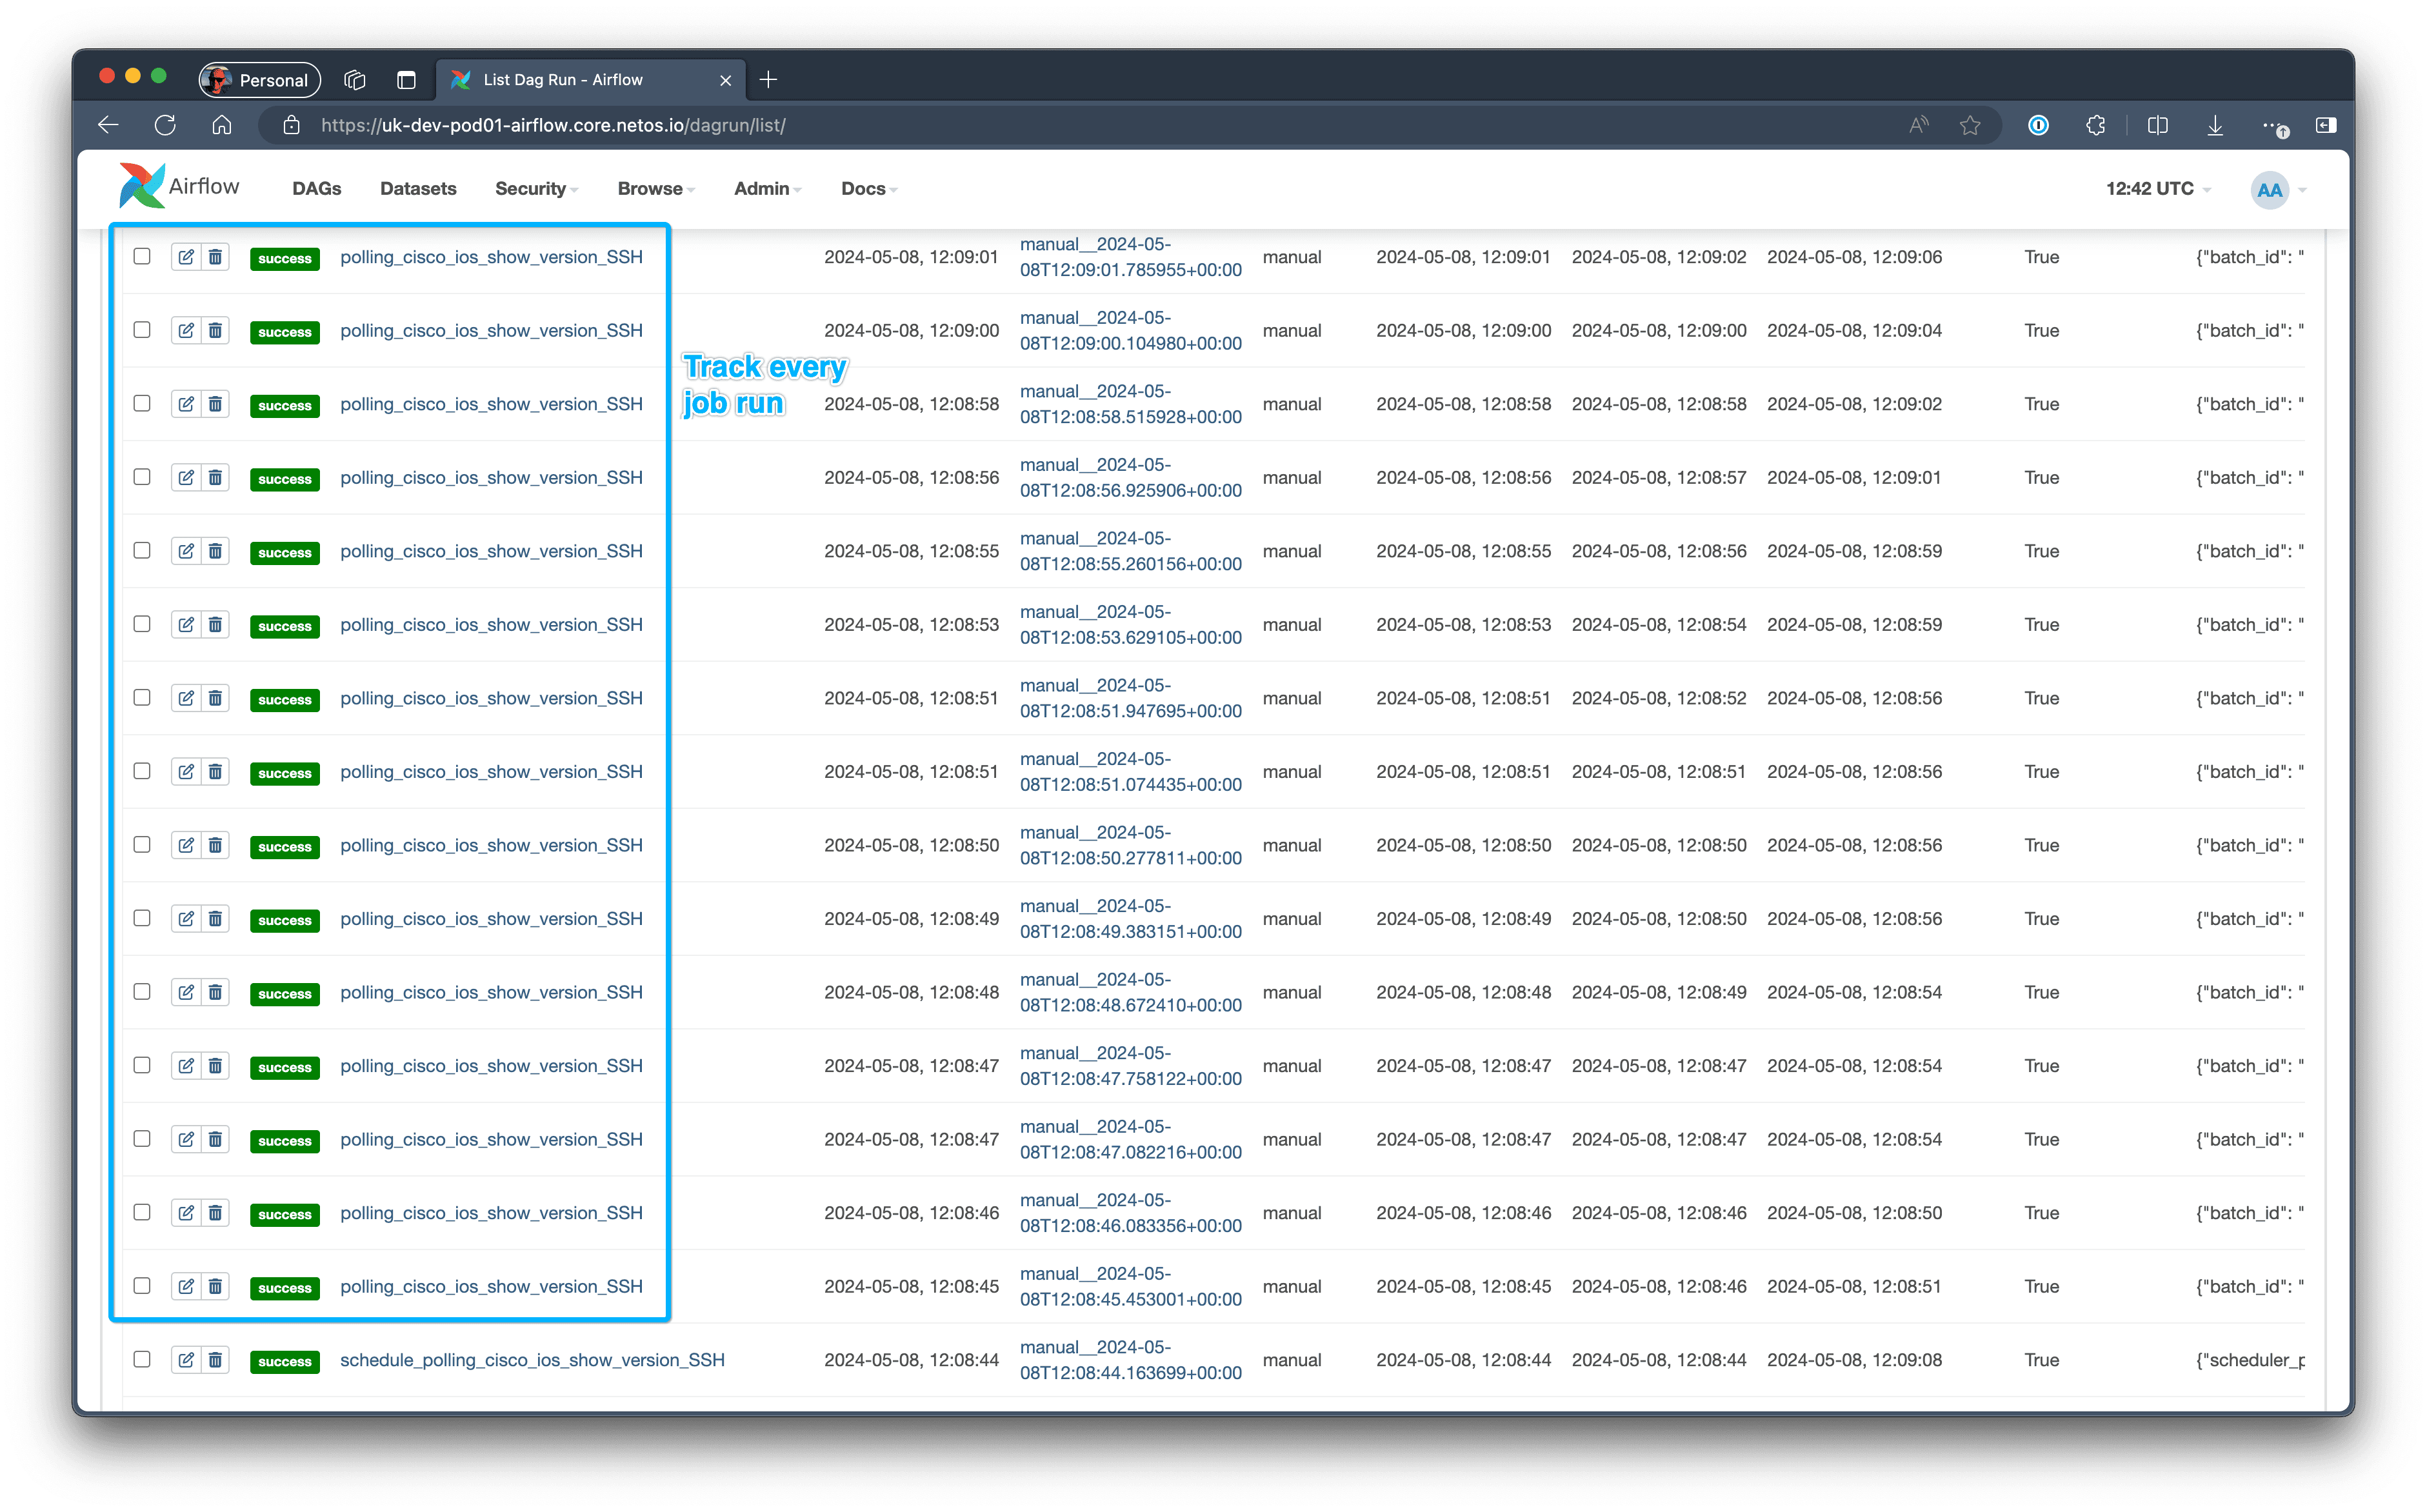
You can see in this screenshot of the Airflow UI completed and failed DAG runs. We have a DAG for each type of job, for example, a DAG that logs into a router, gets the routing table, converts to JSON, and pushes into ElasticSearch for processing later on.
When Airflow is running, we can see all queued, running, failed, and complete jobs in the UI.
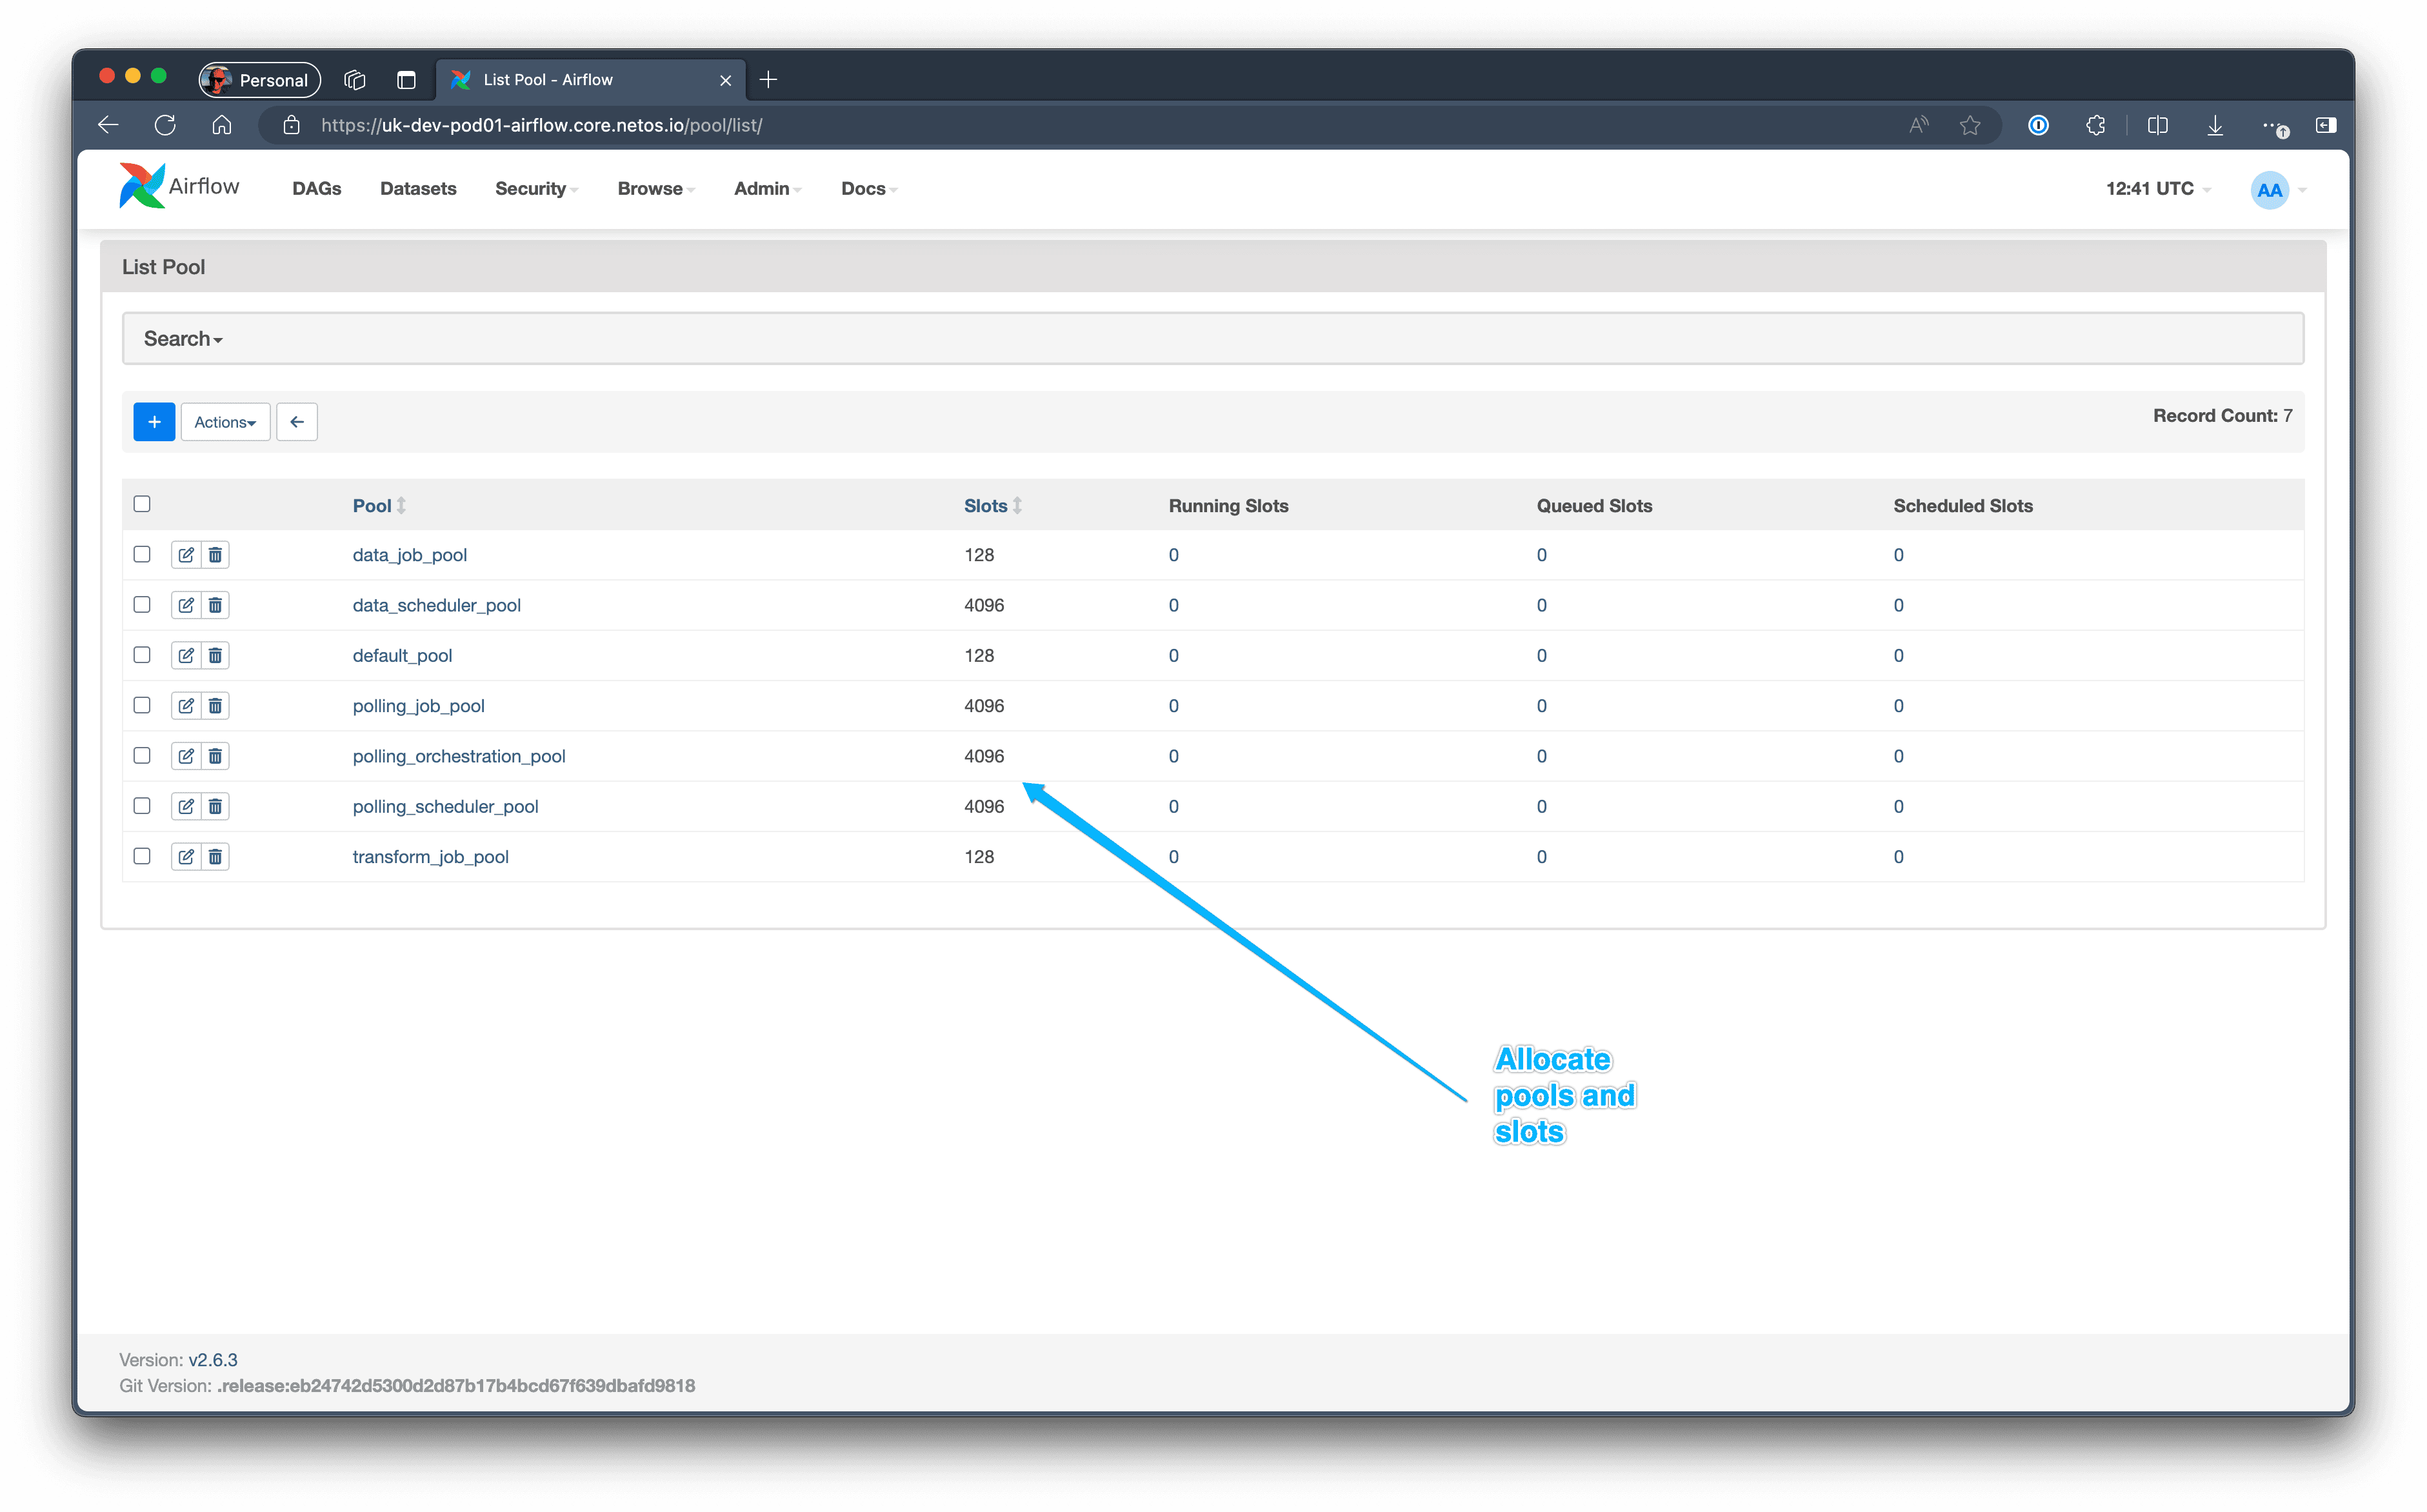
Airflow Pools
In a network of 10,000 devices, it’s entirely feasible to run ten commands on each device during discovery. That’s 100,000 commands all potentially queued up!
In order to protect the integrity of the scheduler, allocate resources based on the server capabilities, and support different types of jobs, we allocate DAGs to different Airflow Pools.
- Polling jobs can be allocated to different pools. For example, we would could prioritize “show version” above “show vlan” in an initial discovery.
- The higher level schedulers and orchestration DAGs are protected in their own pool, so they don’t get clogged up in the poller. This happened early on when we had one pool, i.e. the Polling DAGs prevented maintenance tasks from running and everything died.
- Data synchronization from Elastic to NetBox can run independently and unimpeded in its own pool.
Track Every Job Run
Under normal operation, we don’t need to look under the hood because all status logging is in NetBox. When something goes wrong and we’re running thousands of jobs we need to be able to quickly find exactly what’s happened.
Specifically for Polling DAGs, we spawn a sub-DAG for every polling job (e.g. Airflow initiating an Ansible job to connect to a device) so we have per-device granularity.
Drill Down into the Detail
We can drill down right into the actual job output. For example, we can see the CLI interactions by Ansible on a device, and for API integrations, we can see the transaction logs.
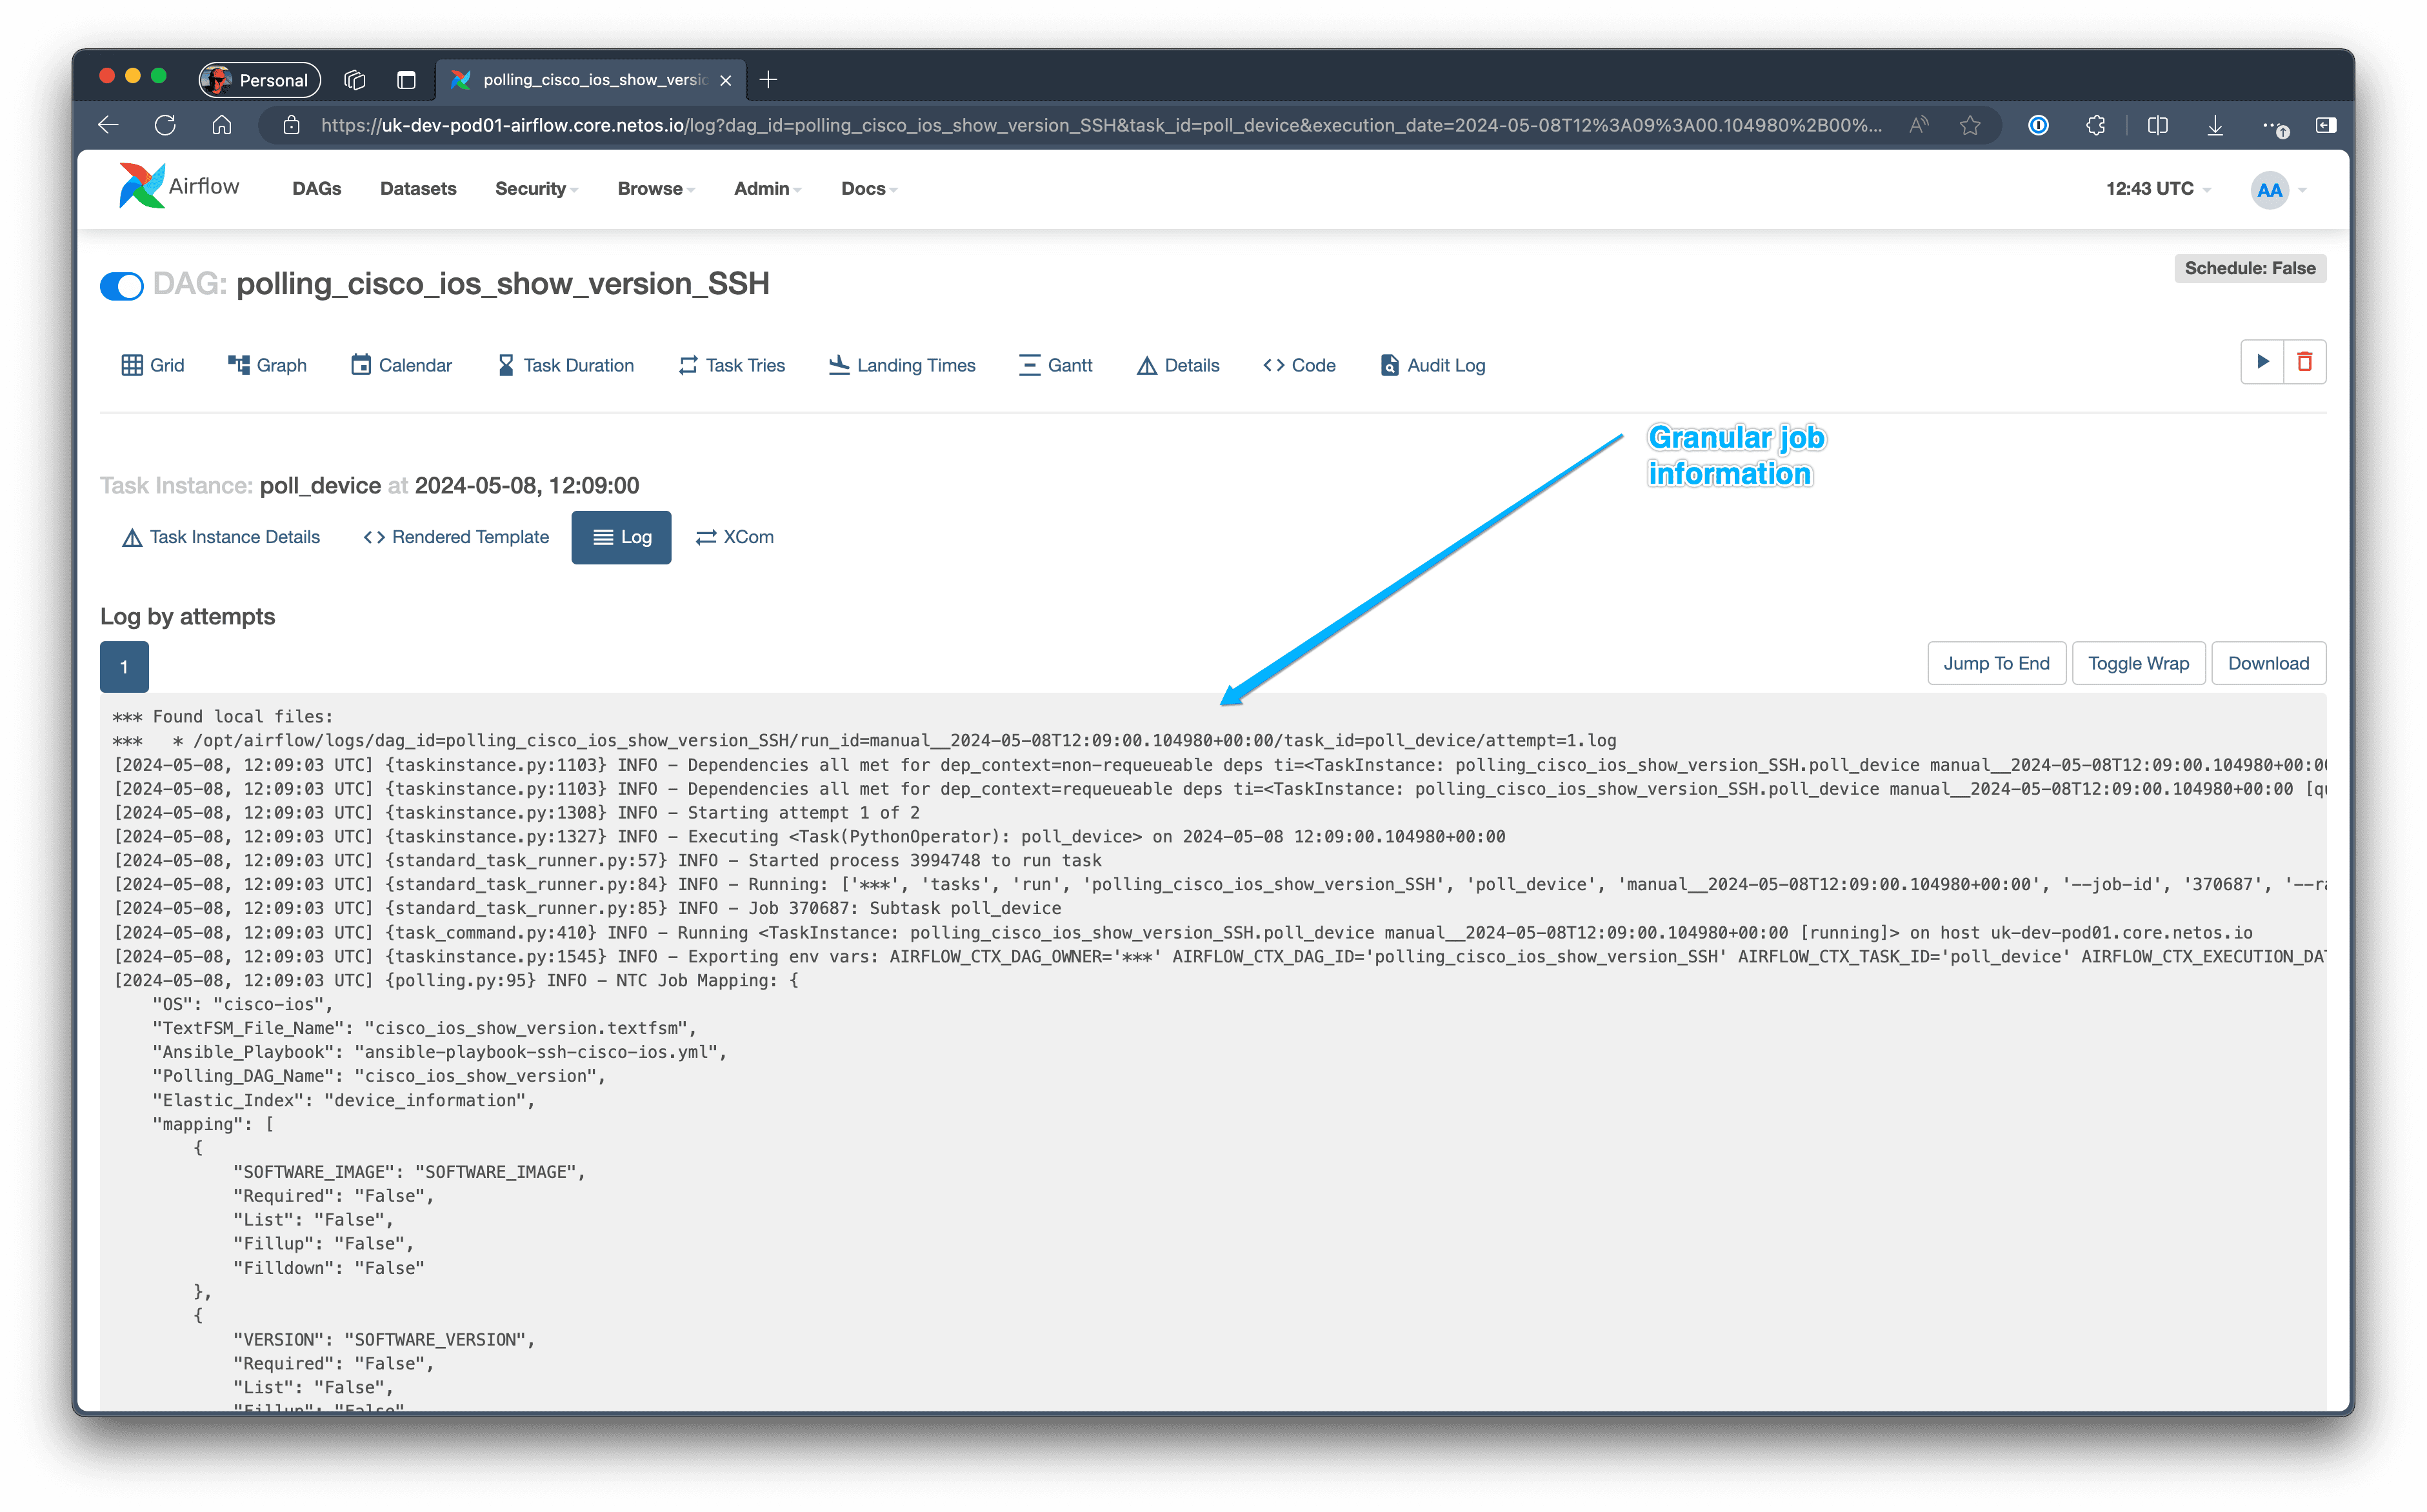
We cross reference every Airflow log with the Polling Tracker log in NetBox, so we can quickly see what happened to a device. From within the NetBox UI (screenshot below) we can follow a link that opens the Airflow logs (screenshot above) for a specific device in Airflow.
We also take the outcome from the Airflow DAG and record it in NetBox. We need to handle unreachable, authentication failures, and authorization failures all differently, and make decisions based on past outcomes for future polling jobs (why continuously try to login to 500 devices when the account has expired).
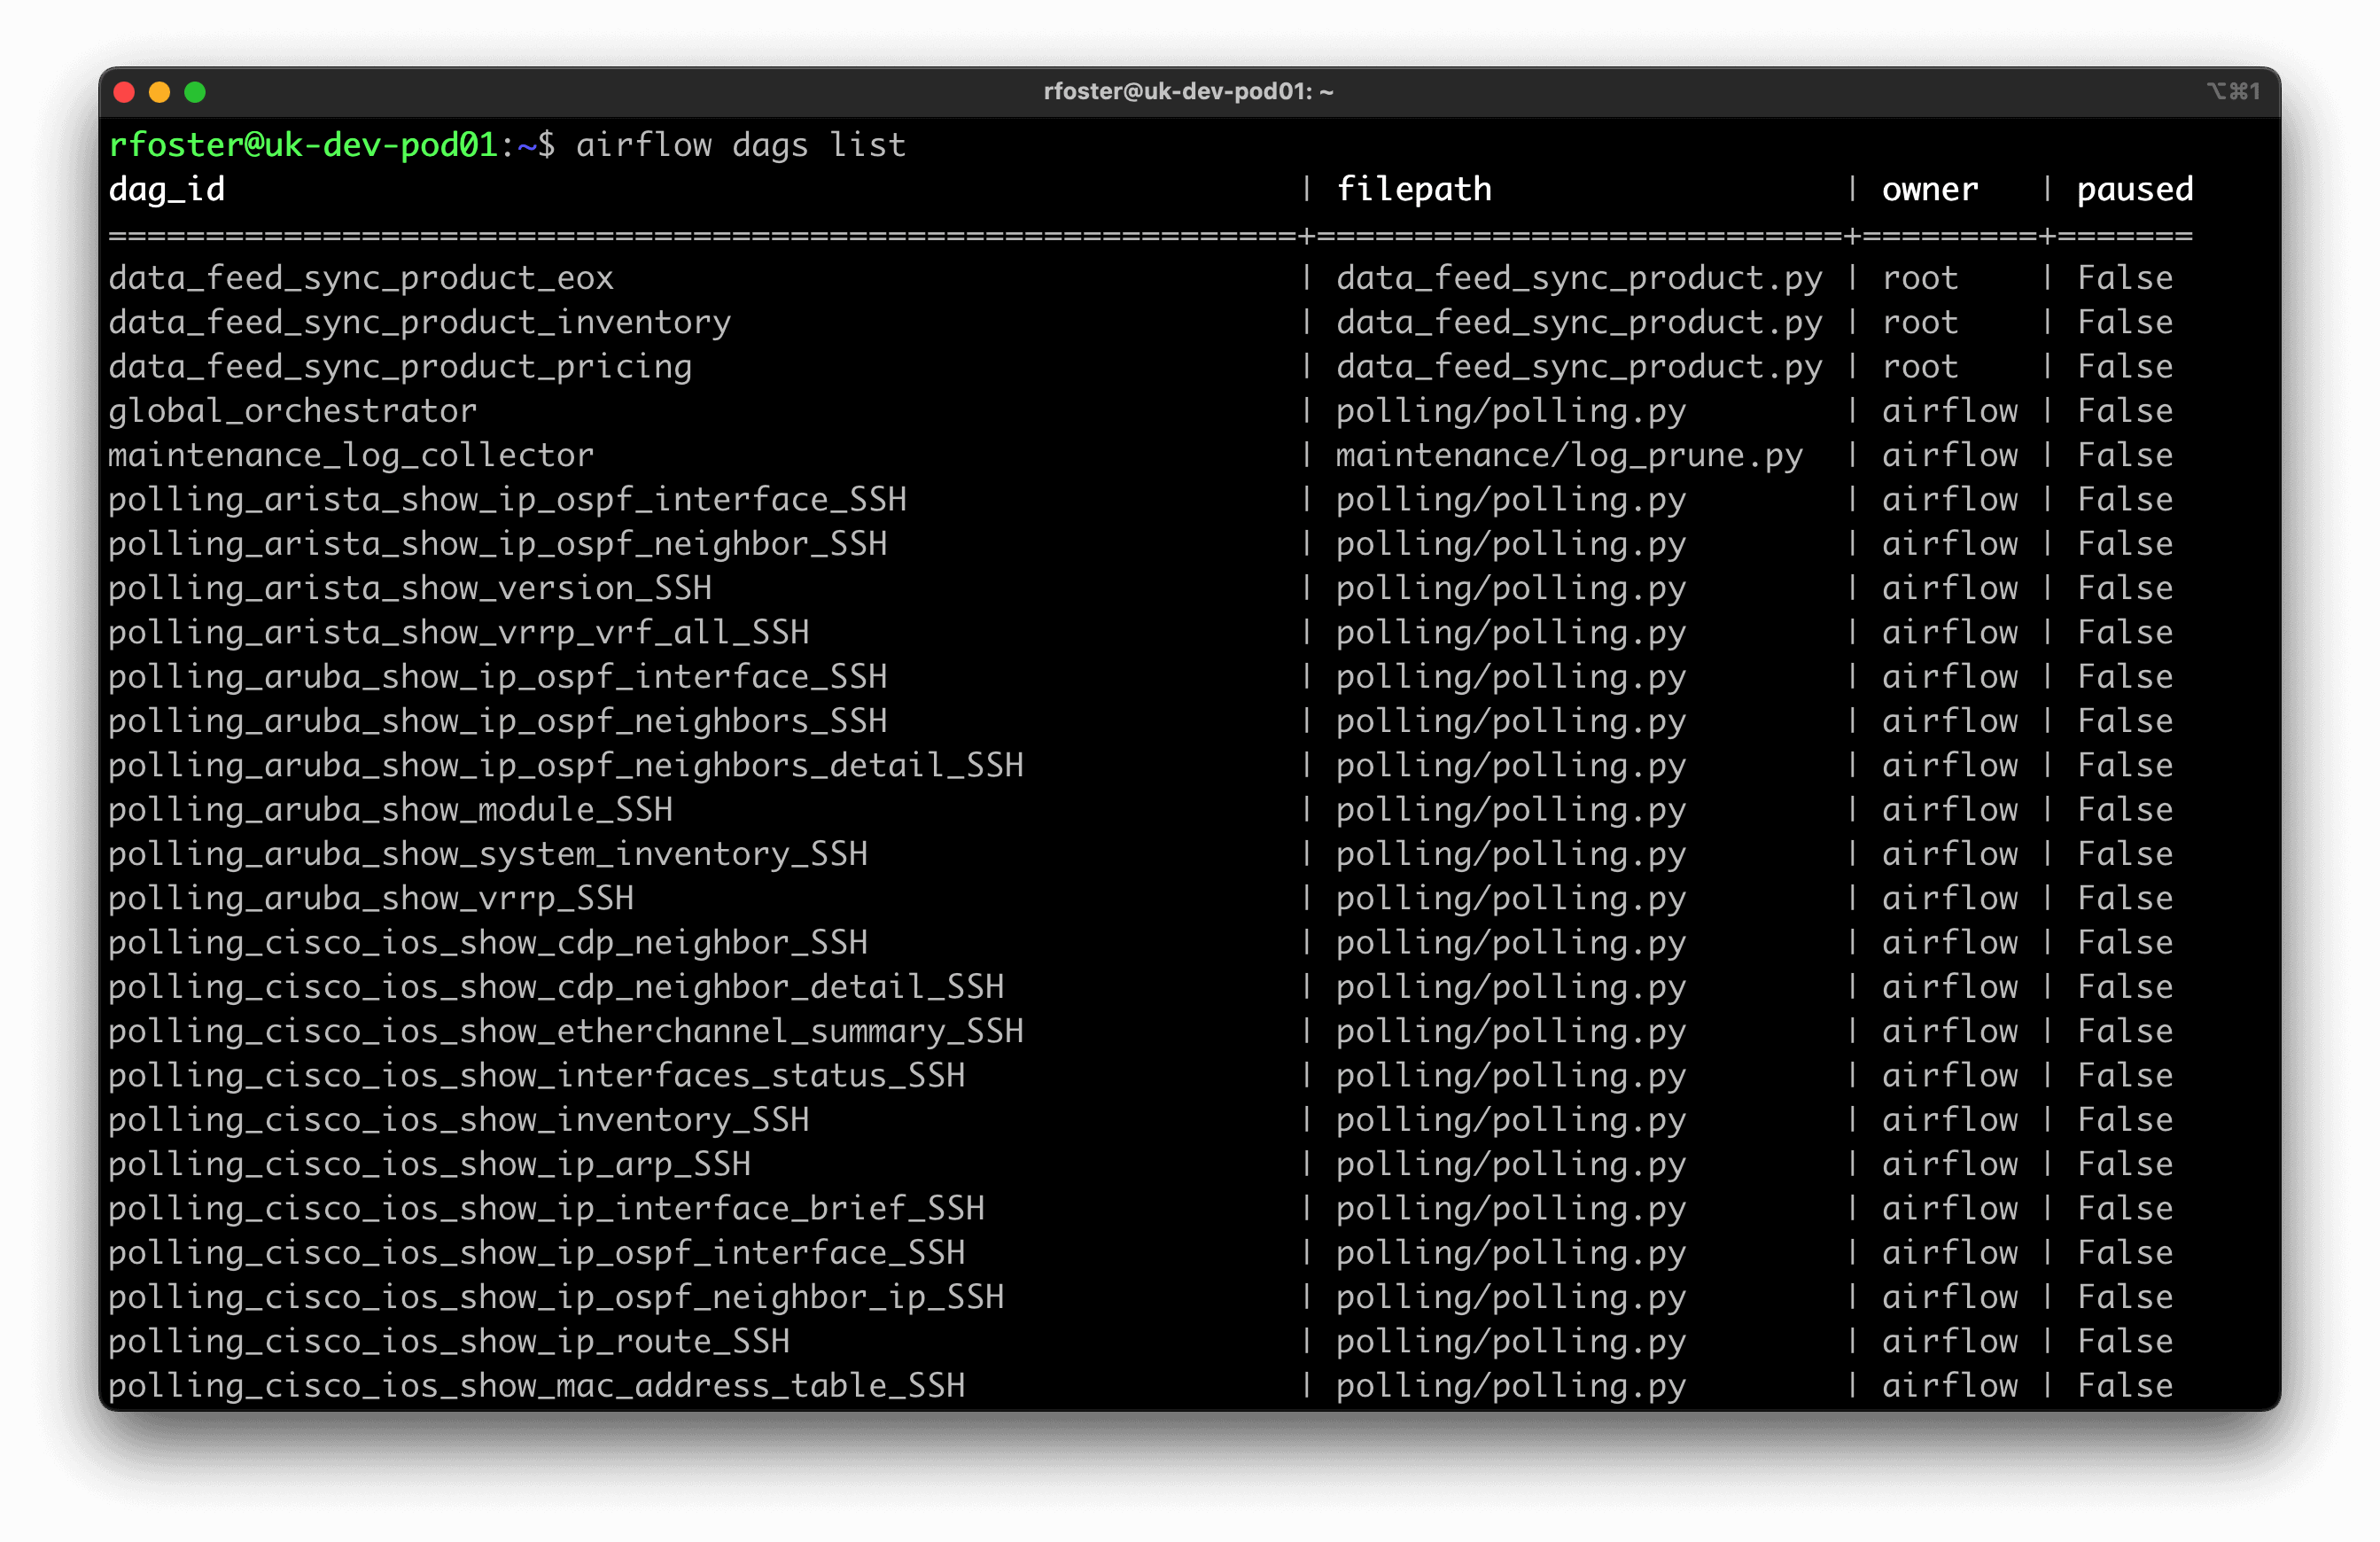
Powerful CLI & API
The UI in Airflow is very powerful. The screenshots above only give a feel, although you can see more on the Airflow website.
In addition, all Airflow features can be managed from the CLI. For testing, we create scripts to automate the initiation of DAGs from the CLI, and use the API to perform local health checks within Netos Pod.
Integrating NetBox
DAG Scheduler
It quickly became apparent that whilst Airflow gave us many benefits, as outlined above, Airflow wasn’t the best place to manage the polling jobs. We wanted control over what discovery jobs would execute, rather than blindly polling everything.
We decided that it was better if no changes were made within Airflow, and the higher level orchestration was managed from within NetBox. Under normal operation, Airflow is read-only, i.e. there is no need to make any changes (other than deploying DAG updates) and everything is controlled from within NetBox.
We developed the Fabric plugin, which enabled us to configure, deploy, and track everything from within NetBox. The following screenshot shows the DAG Scheduler which is used to schedule any type of DAG run.
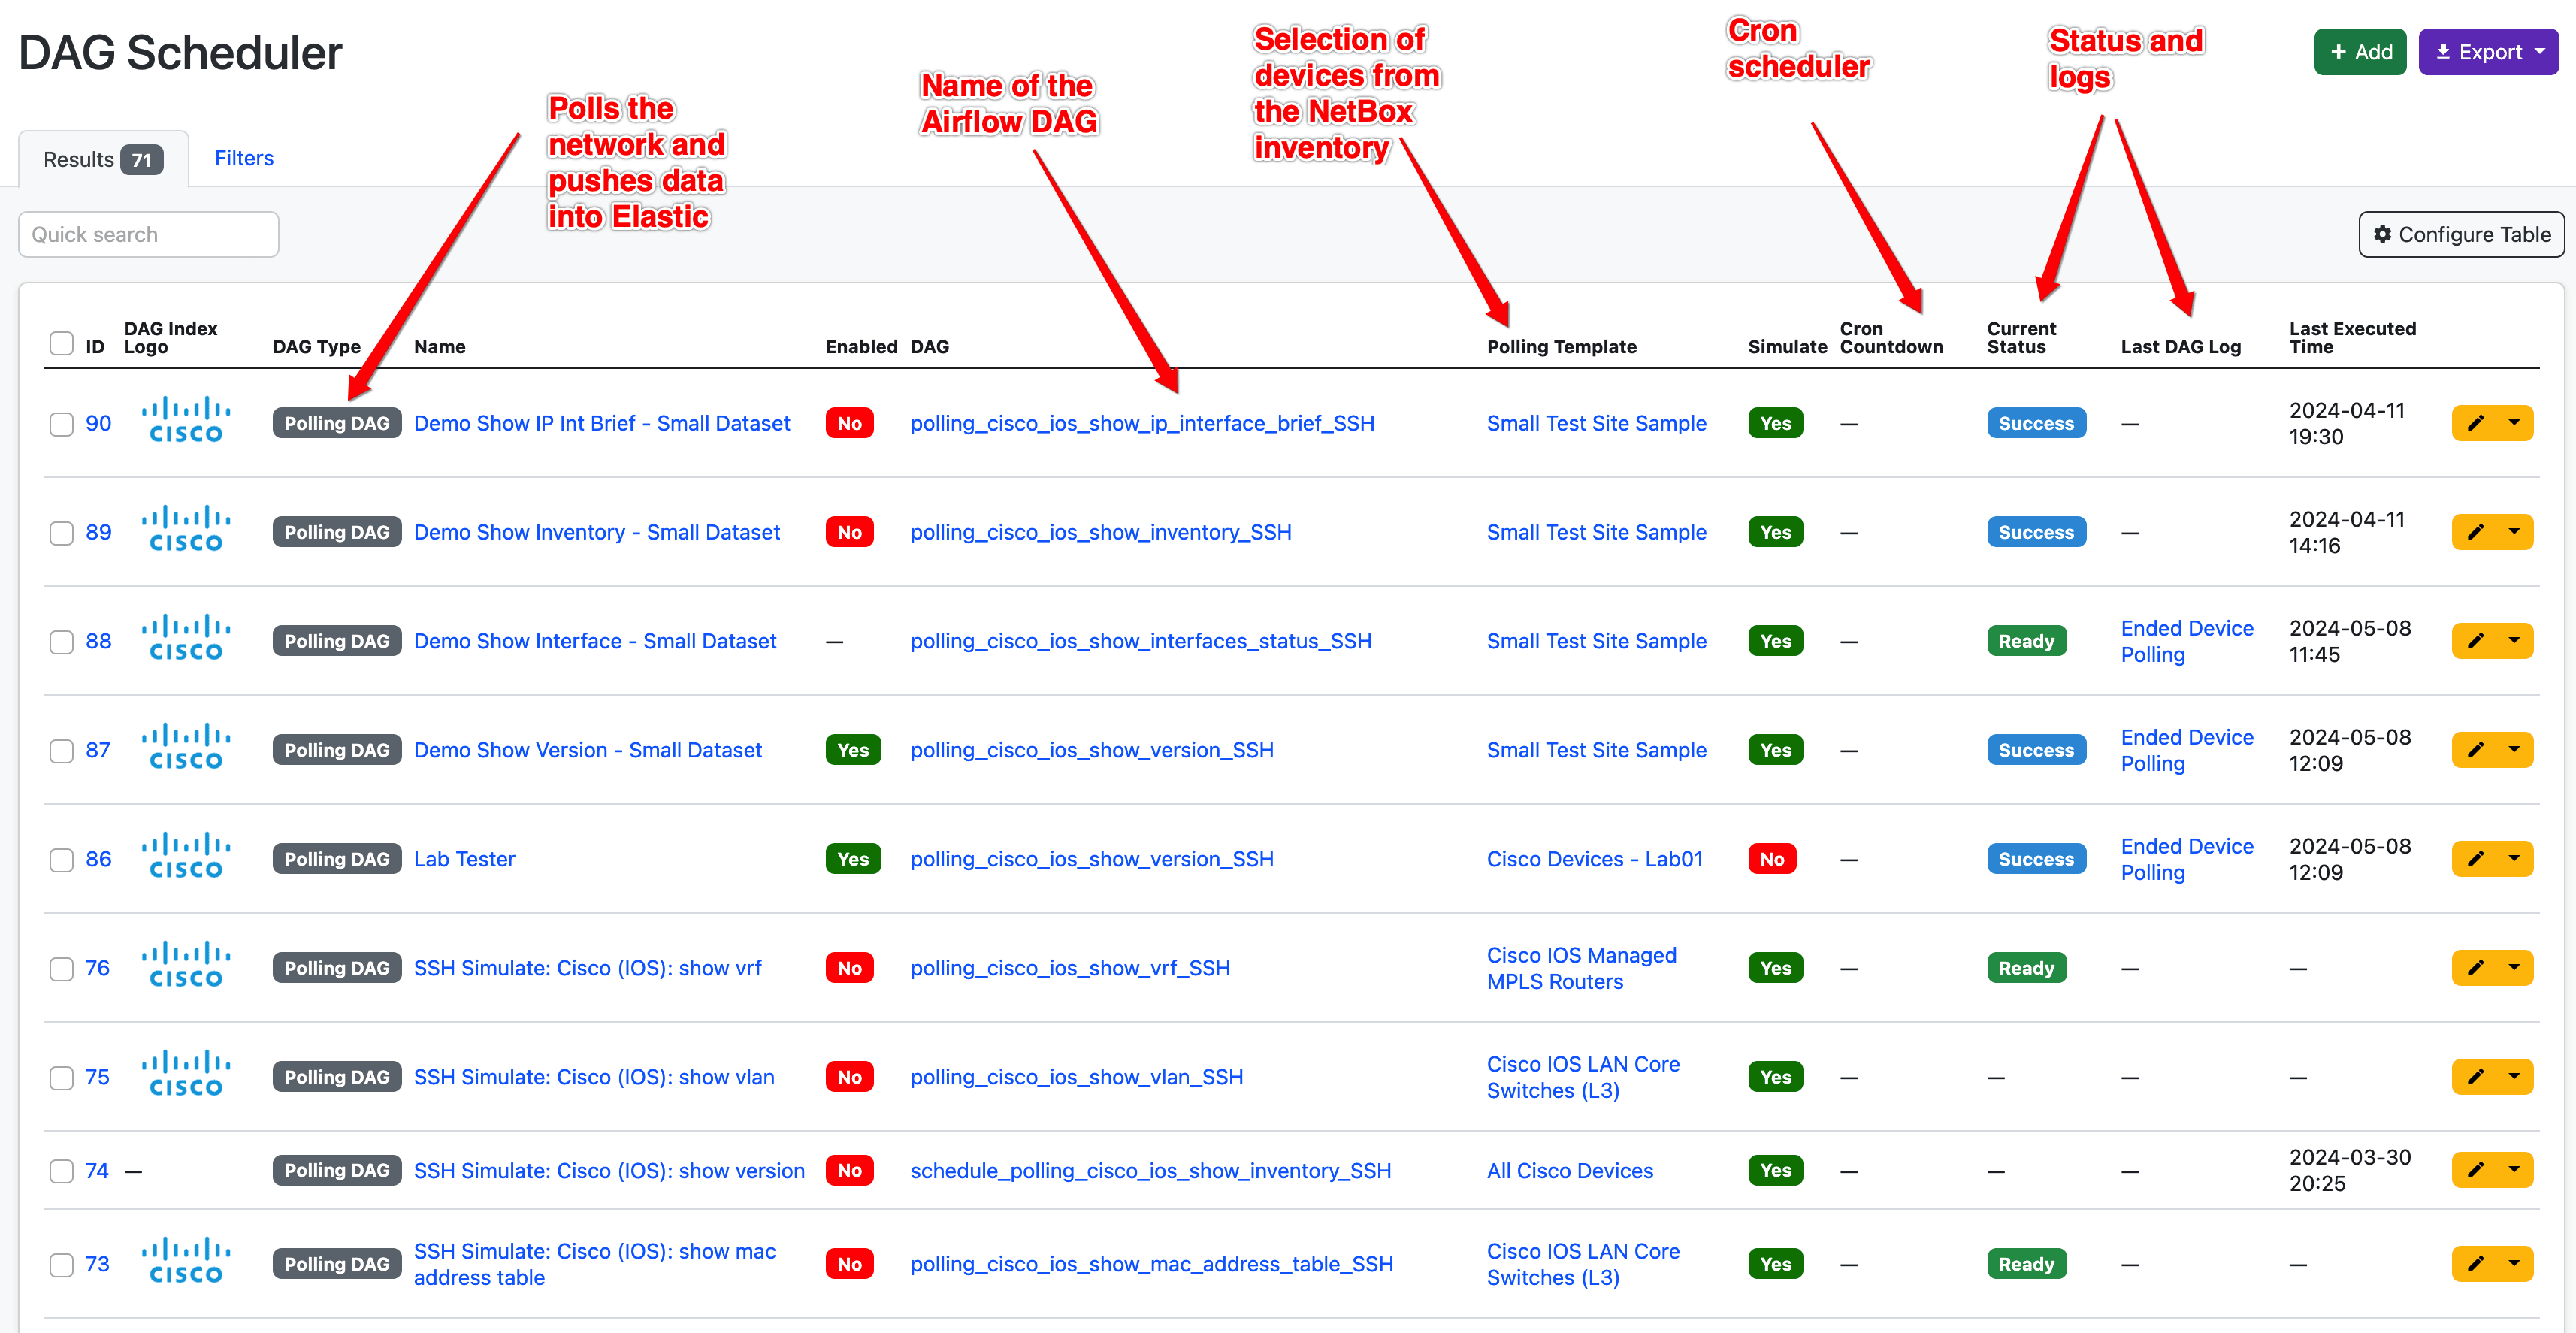
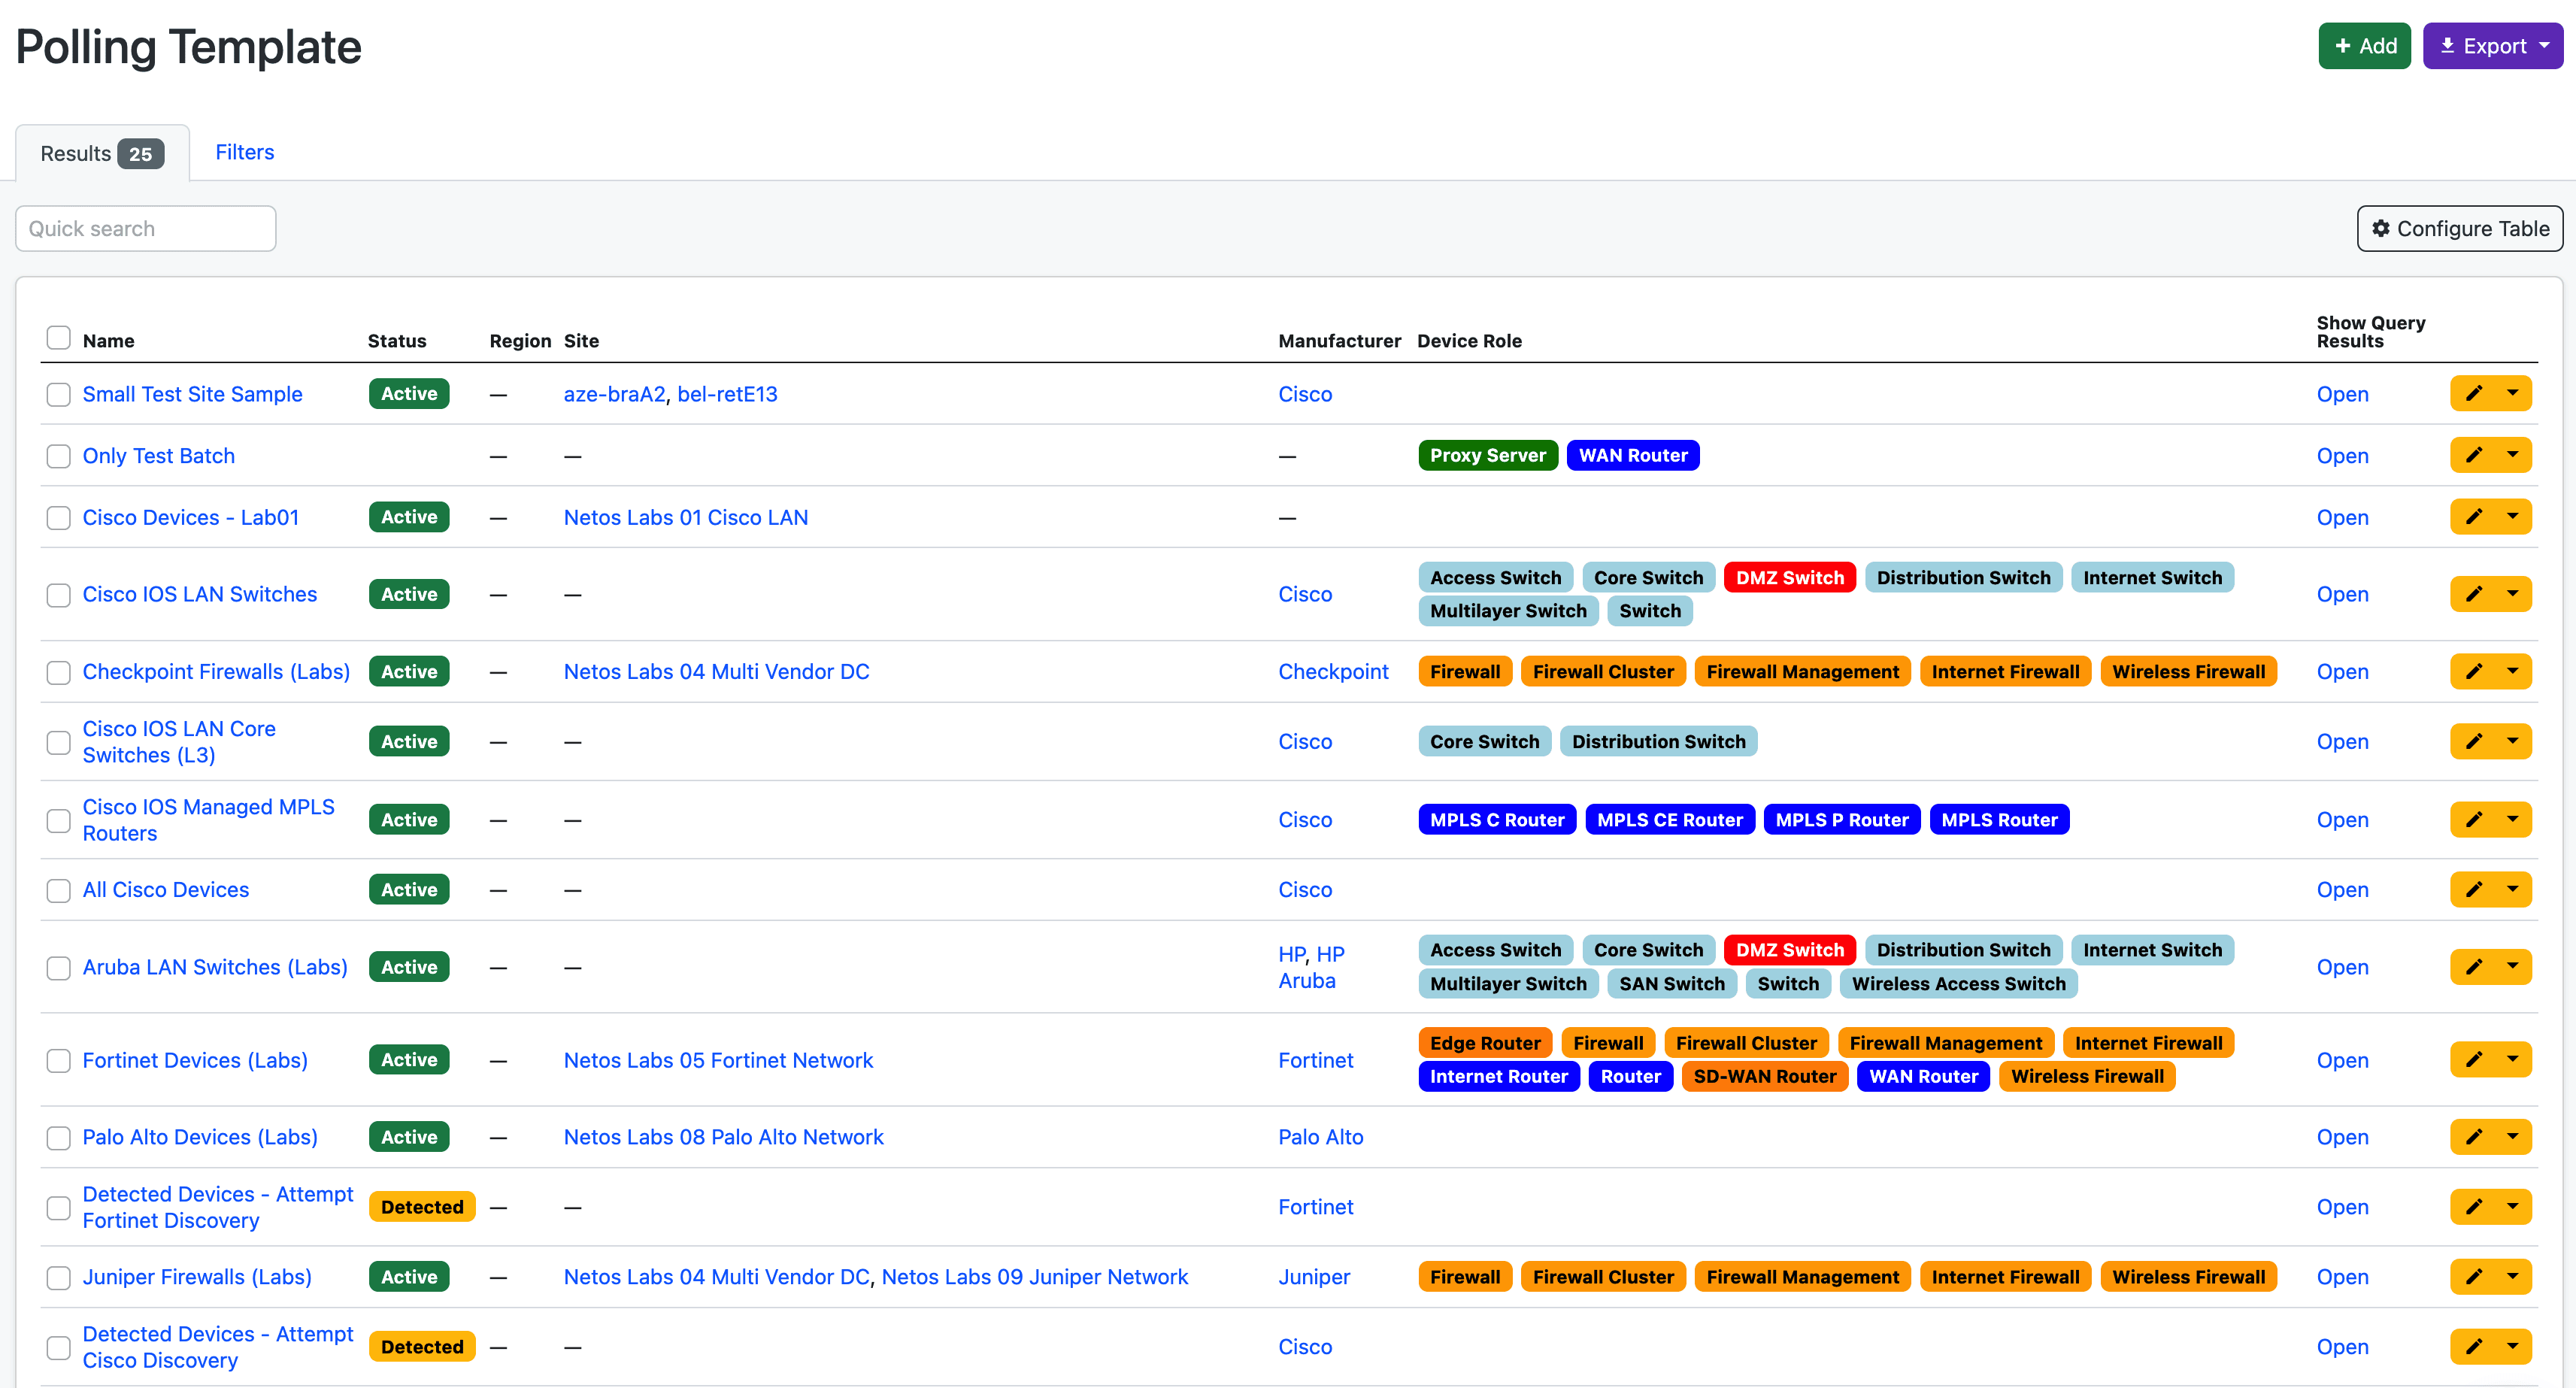
Polling Templates
When polling the network we need to be clear on what we’re polling. With Polling Templates we can group together devices using standard NetBox device fields, and attach them to the DAG scheduler. For example:
- Fortinet LAN switches in branch offices.
- Nexus DC switches.
- Palo Alto firewalls in Asia.
- Partner managed Cisco MPLS routers (global).
We can also extend jobs based on their state. For example, if a CDP discovery job added “Detected” Cisco devices to the NetBox DCIM Device table, we could then have a follow up polling job to attempt to login and discover them.
Data Pipelines & Pre-Staging
Take a Breath
In our original prototypes we pushed data straight into NetBox, i.e. poll the device and push the data into NetBox. This worked well for simple data pipelines, like serial numbers and inventory data, because we’d take it from the device and update NetBox.
As soon as we started trying to do anything complex that required data from multiple commands, or tables (for example, seeding IPAM requires different data), it was impossible (very unstable and unpredictable) to process and structure the data in real-time, whilst maintaining stability and integrity. Troubleshooting was also very difficult.
For example, when parsing the Cisco “show ip interface brief” command and the IP addresses from that table, the subnet masks are not included. We therefore needed to get the subnet mask from the routing table, which is why it’s very useful to have all the data prep’ed and in Elastic before doing anything clever.
We pre-stage all the data in vendor-agnostic indices in a dedicated per-deployment Elastic instance. The Data DAG is the logic and populates NetBox, including creating relations between records, for example, if an IP Prefix is found on a router in Site A, we need to create a link between the prefix record and Site A.
Benefits of Pre-Staging
- Flexibility in Data Use – By having the data available in Elastic we can process, clean, and reconcile it in advance of pushing into NetBox.
- Deal with Complex Relations – By first getting all the data into different indexes, and then processing it, the pipelines and logic is simplified.
- Analytics & Troubleshooting – Using Kibana we can quickly analyse the data, create dashboard and reports.
- Time Series – NetBox only provides a snapshot of the current state. Elastic and Kibana allow for historic time series data analysis.
Solution Design
Netos Pod & NetBox
To bring everything together, these are the core components of our solution:
- NetBox – Network inventory with custom plugins to deliver Netos features.
- Airflow – schedules DAGs, e.g. polling devices, or syncing data to NetBox.
- Ansible – polls network devices, e.g. collects status information from a router.
- Elastic – Data Lake for pre-staging polled data from the network.
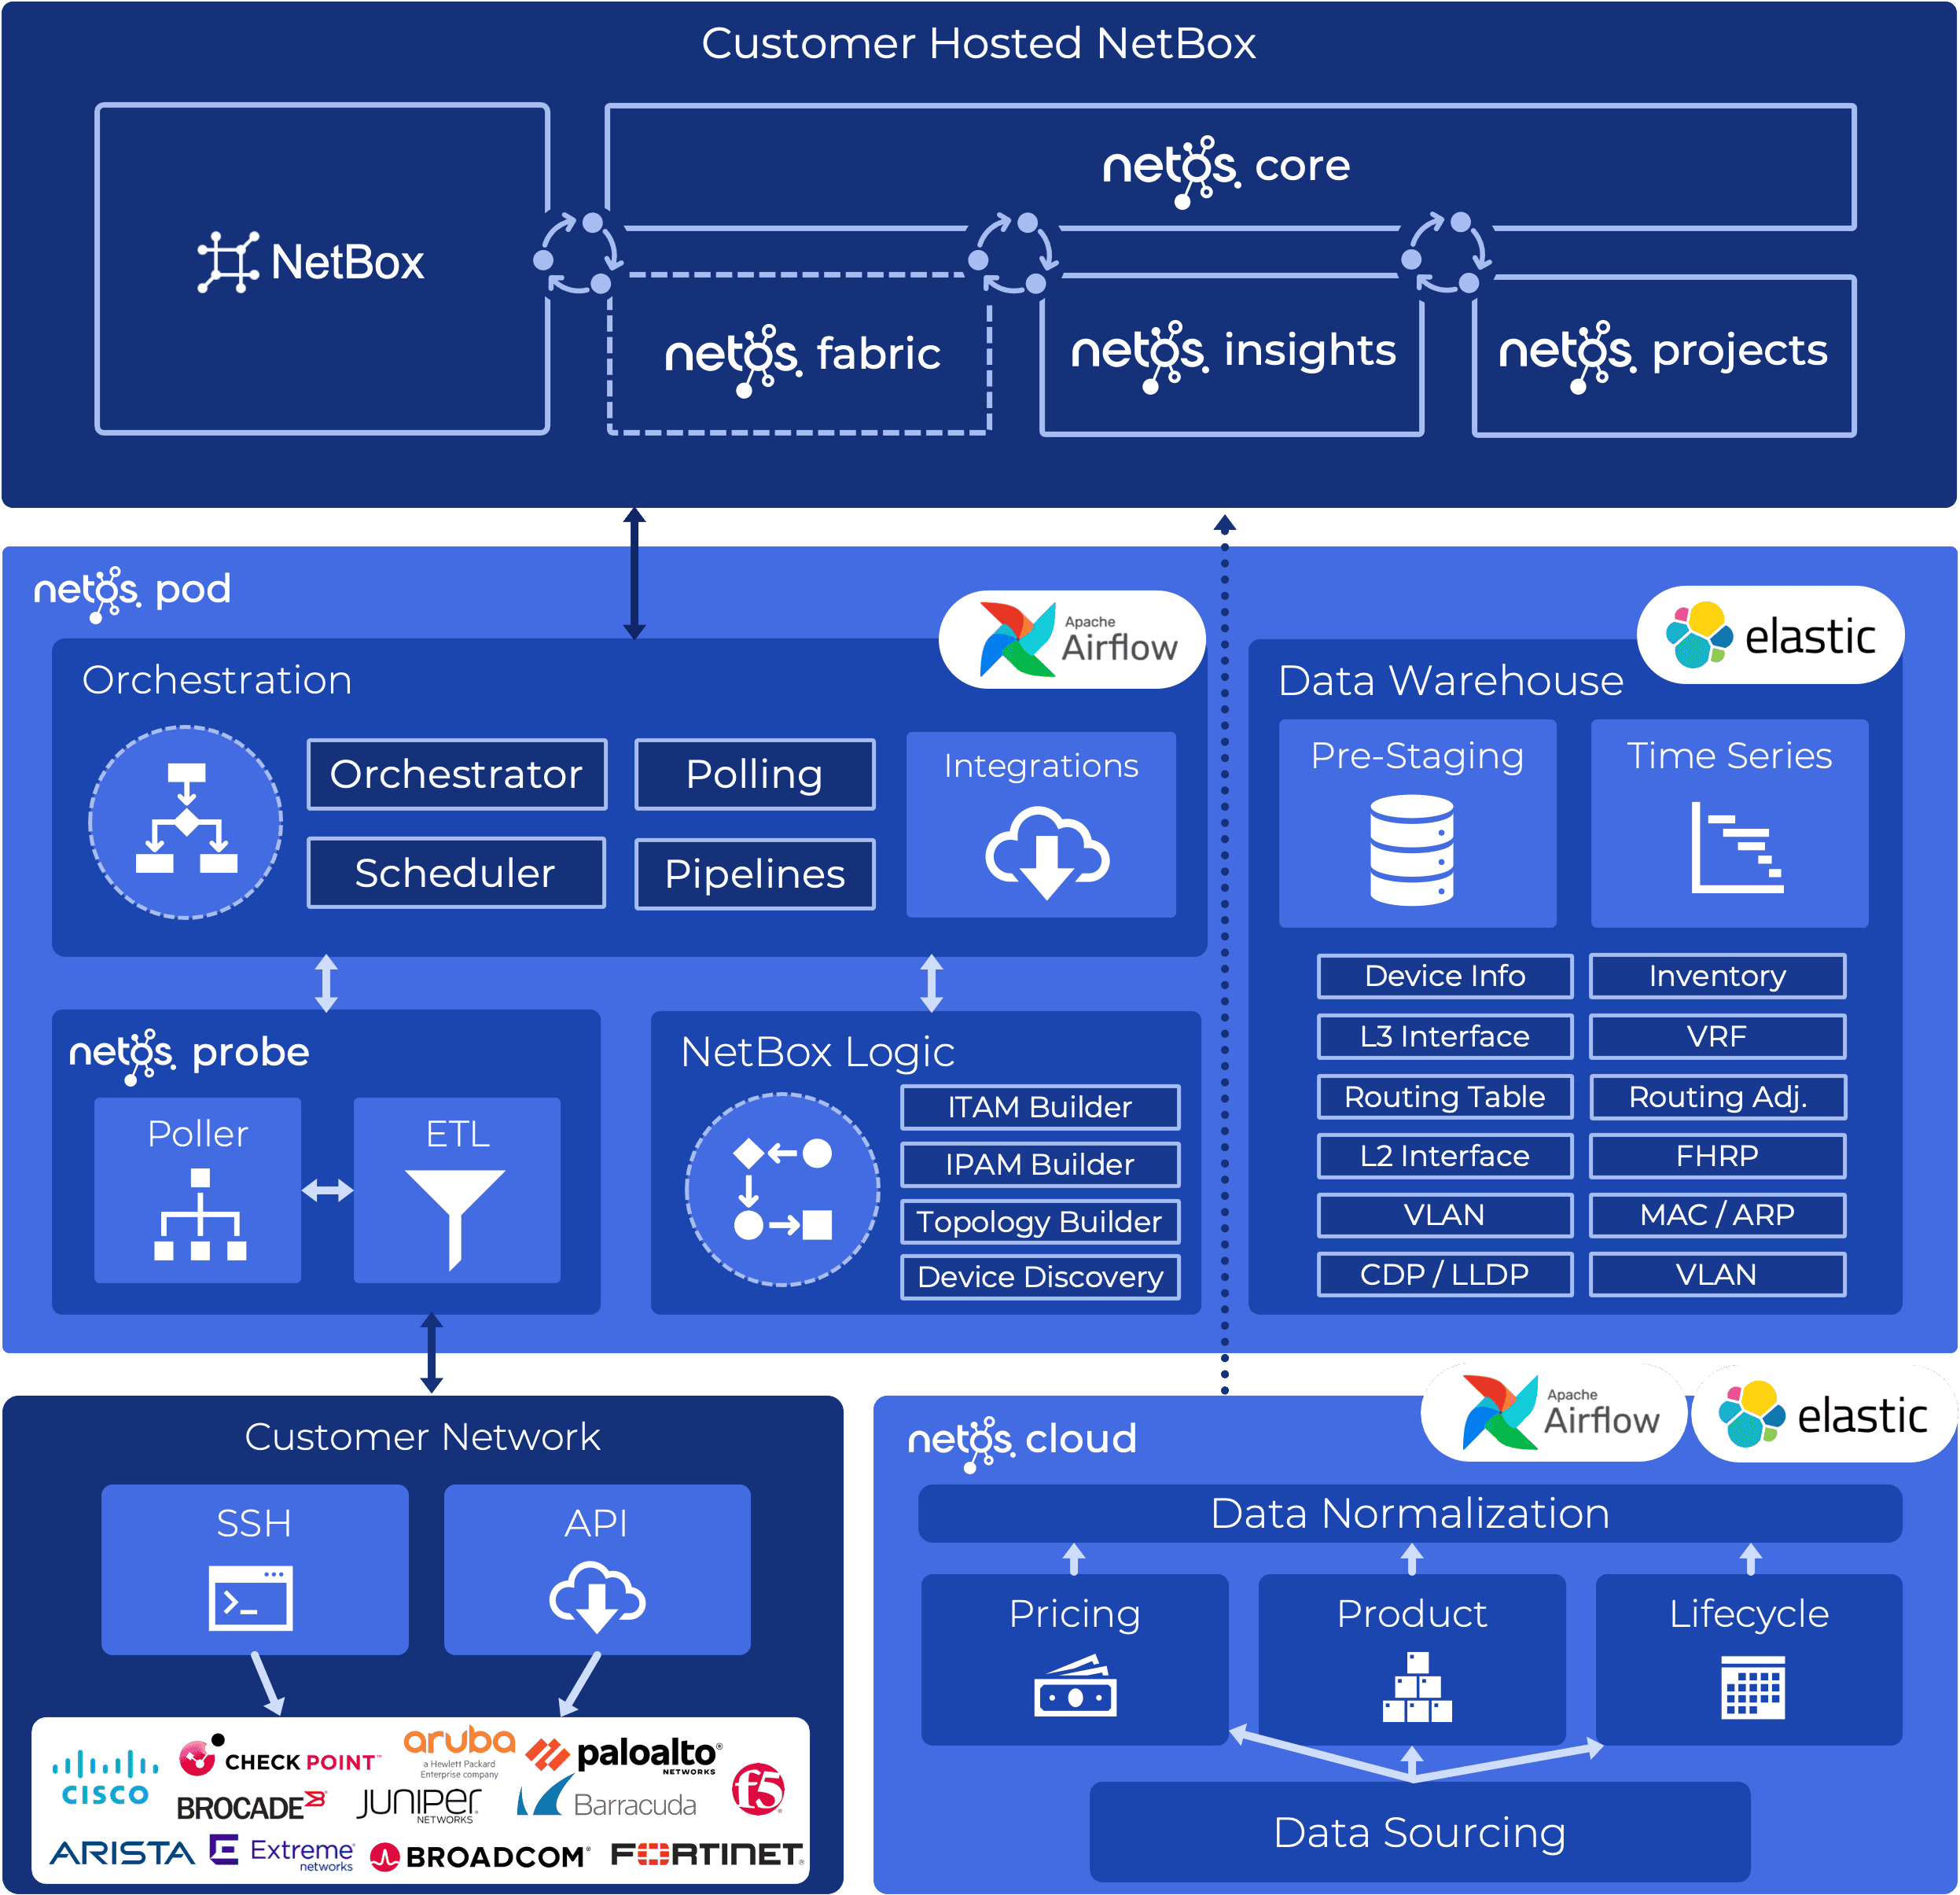
Solution Overview
This diagram shows how everything fits together, with Airflow (in the middle) central to all network discovery.
We use Airflow for other internal applications as well. For example, in our Netos Insights solution we source End of Life data, and in Netos Projects we source pricing data. This is shown in the bottom right (Netos Cloud) of the diagram.
Lessons Learnt
Airflow is complex and very powerful. For our use case we’ve only scratched the surface. Here are a few lessons we learnt along the way.
- We had a lot of stability issues with the Docker instance of Airflow. When we installed native to the server, those issues went away.
- Logs can get massive. Once we generated 100GB per day on some test data. DAGs should be coded to be efficient and not too verbose, and we also have Maintenance DAGs to clean up logs and the Airflow database.
- It’s easy to kill the server if you don’t allocate pools and resources correctly. It will suck up every CPU cycle if you let it…!
- We avoided using XCOM to transfer state information between DAG tasks, primarily because we didn’t need it, but also we didn’t want sensitive data in clear text in the logs.
- It takes up to 5 mins for DAGs to load in the UI after deployment (nothing is broken!)
- It takes a huge amount of time to provision and configure everything, so we use Ansible Semaphore to deploy everything in a few clicks.