What does your network really cost?
Network TCO (Total Cost of Ownership) is a growing concern—but how do you accurately measure what your network really costs to run?
Once your data center is built, the campus network and WiFi is deployed, the real question is: What will it cost to operate and maintain over the next five years?
Modeling TCO for a Banking Network Refresh
The objective was clear: model and compare the operating costs of a new data center and campus network across multiple vendor solutions.
Netos applied this framework to help a leading network vendor (leader in multiple Gartner quadrants) demonstrate $1M in operational savings to a new banking customer, as part of a $4M network refresh project.
Netos analysis was presented to the CTO and was instrumental in the vendor getting selected. The model can be applied, in a matter of days, to any enterprise network.
Maintenance & Upgrades: The Hidden Costs
Keeping your network running smoothly is an ongoing challenge for most network engineering teams. It’s not just about uptime—it’s about managing the constant stream of issues, updates, and unexpected events that can impact performance and cost.
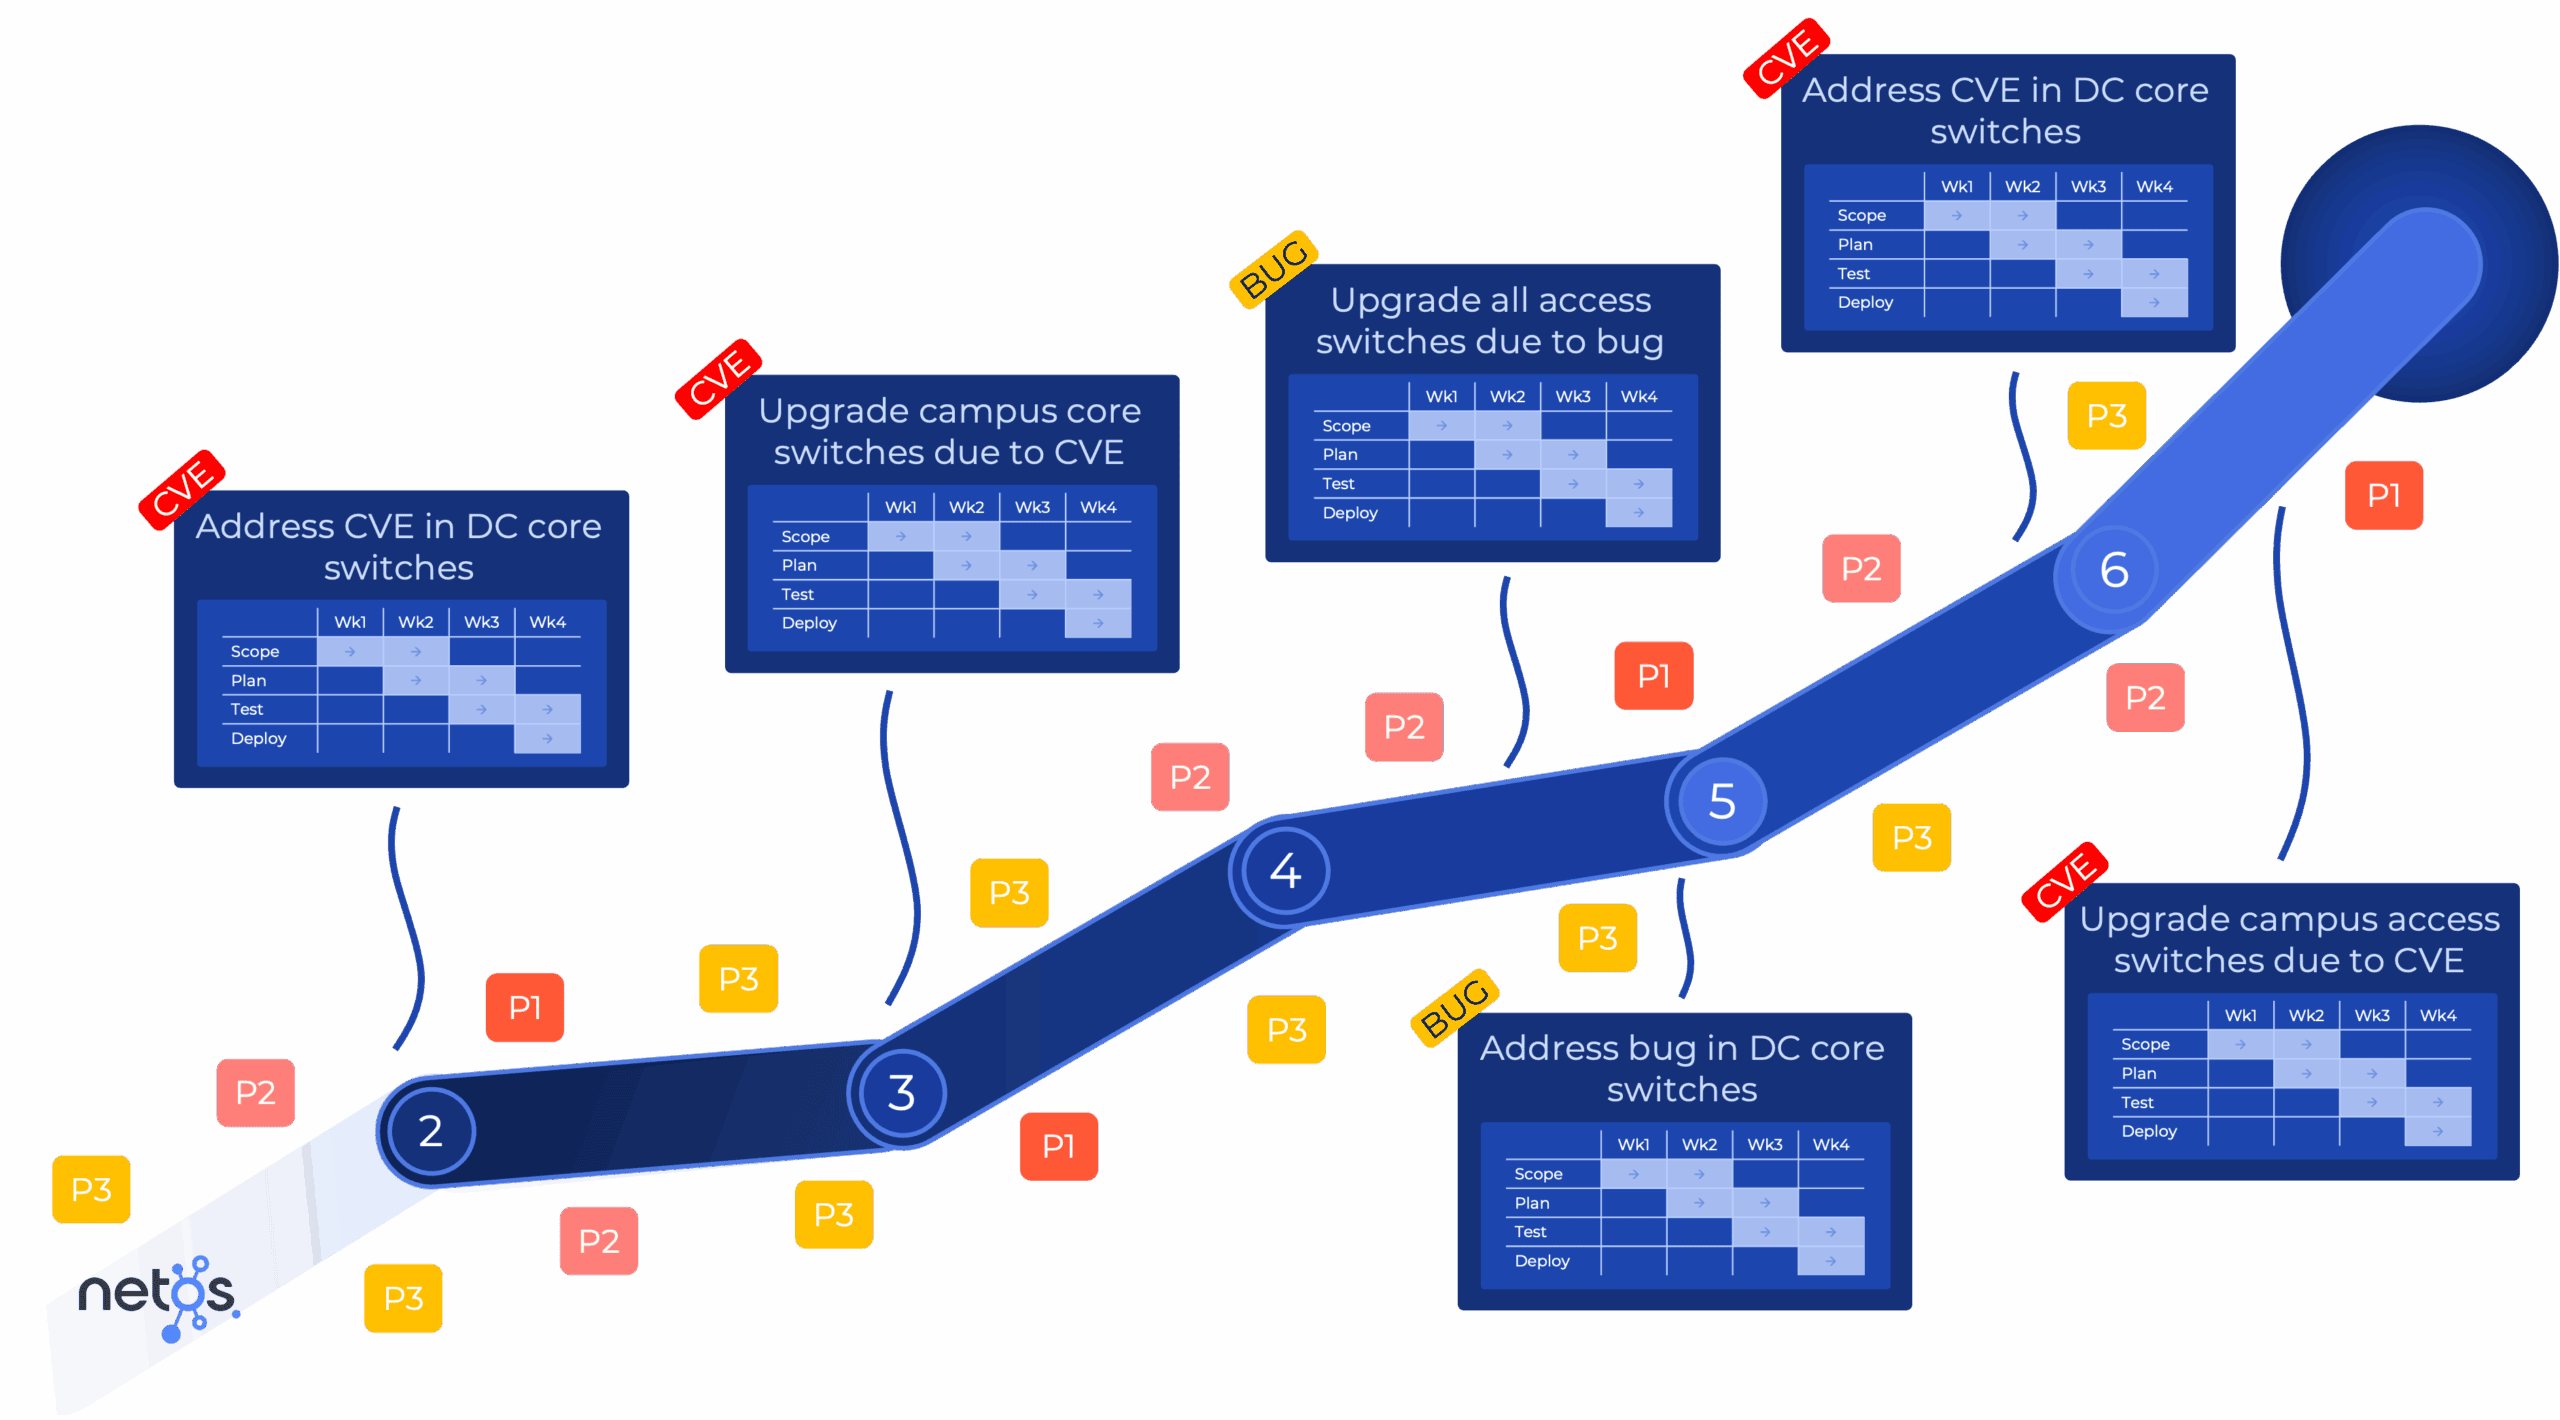
- Bug – A software feature causing unexpected behavior or failure
- CVE – Critical security vulnerabilities that may force urgent upgrades
- P1 Incident – A full outage impacting the entire business
- P2 Incident – A partial outage affecting a key service or location
- P3 Task – Routine maintenance or scheduled updates
The illustration below shows a timeline of events over six years. Don’t underestimate how hard your Network Team are working behind the scenes just to keep the lights on!
The Overhead Behind Every Upgrade
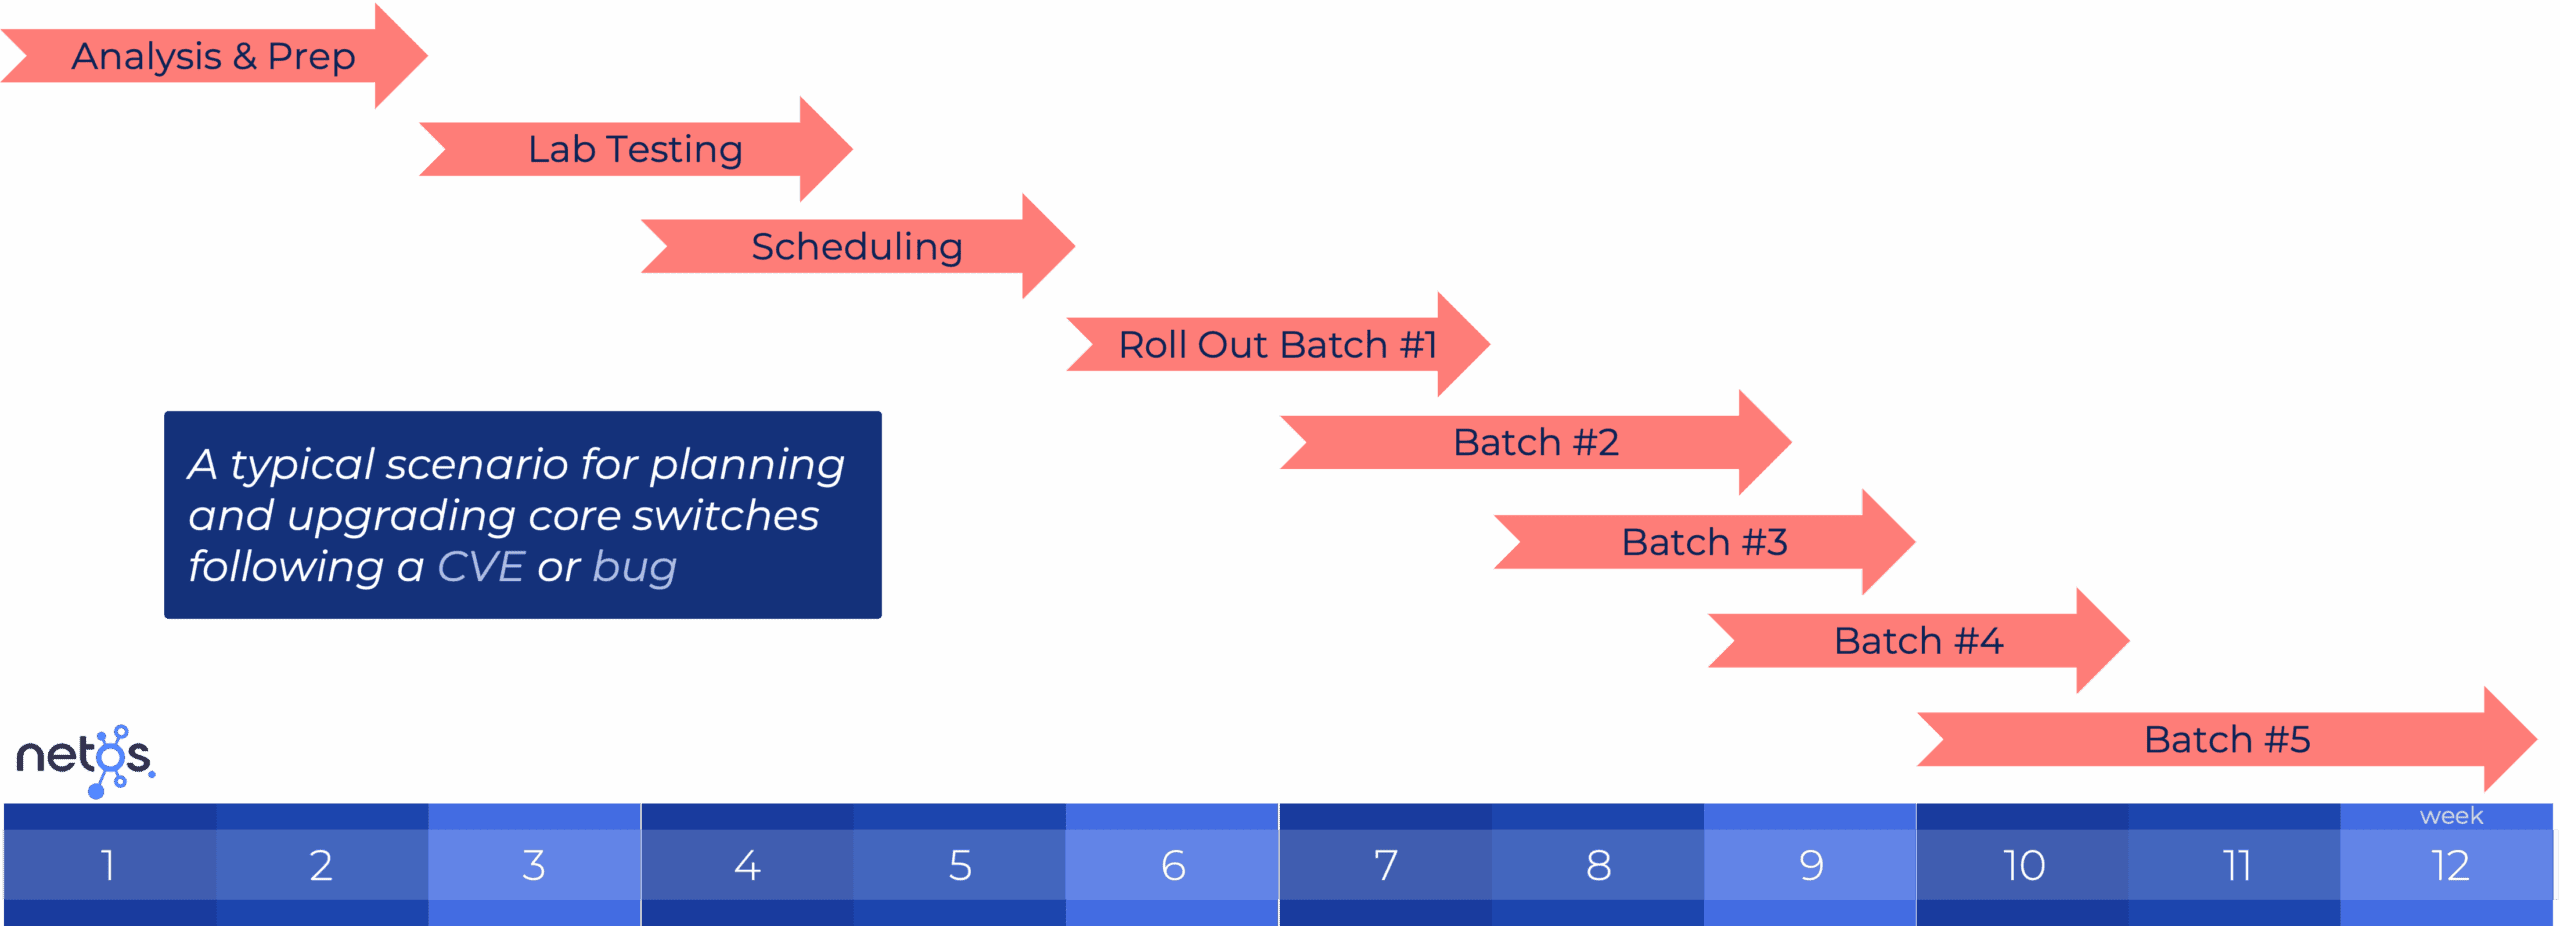
Let’s say your data center switches are hit by a known bug. Sounds simple—but fixing it often isn’t.
From identifying the issue to deploying a fix in production, the process can take weeks or even months. Multiple teams get involved, each adding time, complexity, and cost:
- Network Engineering – Lab testing, research, planning, and deployment
- Project Management – Coordinating resources, change windows, and stakeholder alignment
- Change Management – Manages risk, approvals, and compliance procedures
- Testing Teams – Often scheduled over weekends or out-of-hours to validate the fix in staging and production
Even routine updates can become multi-phase projects requiring significant planning and collaboration. All distracting from adding value to the business.
While the technical fix might take minutes to apply, the organizational effort behind it can be hundreds of hours of work.
Build a Customer Profile
To accurately model TCO, we first look at the unique characteristics of each customer environment. This can be captured in a 45 minute call with the Network Director.
- Network Criticality – The business impact of network downtime
- Solution Complexity – Number of platforms, integrations, and operating systems
- Upgrade Frequency – How often the network requires software updates
- Pre-Planning – Effort required for testing, validation, and rollout scheduling
- Platform Count – The number of hardware/software versions in use
- Resource Costs – Engineering, project management, and support overhead
- Solution Stability – Frequency of unplanned outages and emergency fixes
Every organization is different. For example, a global investment bank based in New York may face higher TCO due to elevated regulatory compliance, critical uptime requirements, and higher resource costs.
In contrast, a mid-sized enterprise with a simpler, more standardized environment may have fewer variables driving up operational cost—but still benefit significantly from better visibility and control.
TCO Scenario Framework
With the TCO framework in place, we can begin building scenario models that illustrate how different variables impact long-term cost and operational risk.
- Solution – The criticality and complexity of the proposed network
- Maintenance Cycles – The level of planning required, upgrade frequency, and number of OS platforms
- Maintenance Tolerance – Resource costs and the expected stability of the solution, based on historic and known CVEs and bugs
- Incident Frequency – Projected volume of P1, P2, and P3 incidents associated with the new design
The example below outlines four scenarios—such as those common in a banking environment—each reflecting different levels of complexity, stability, and overhead.
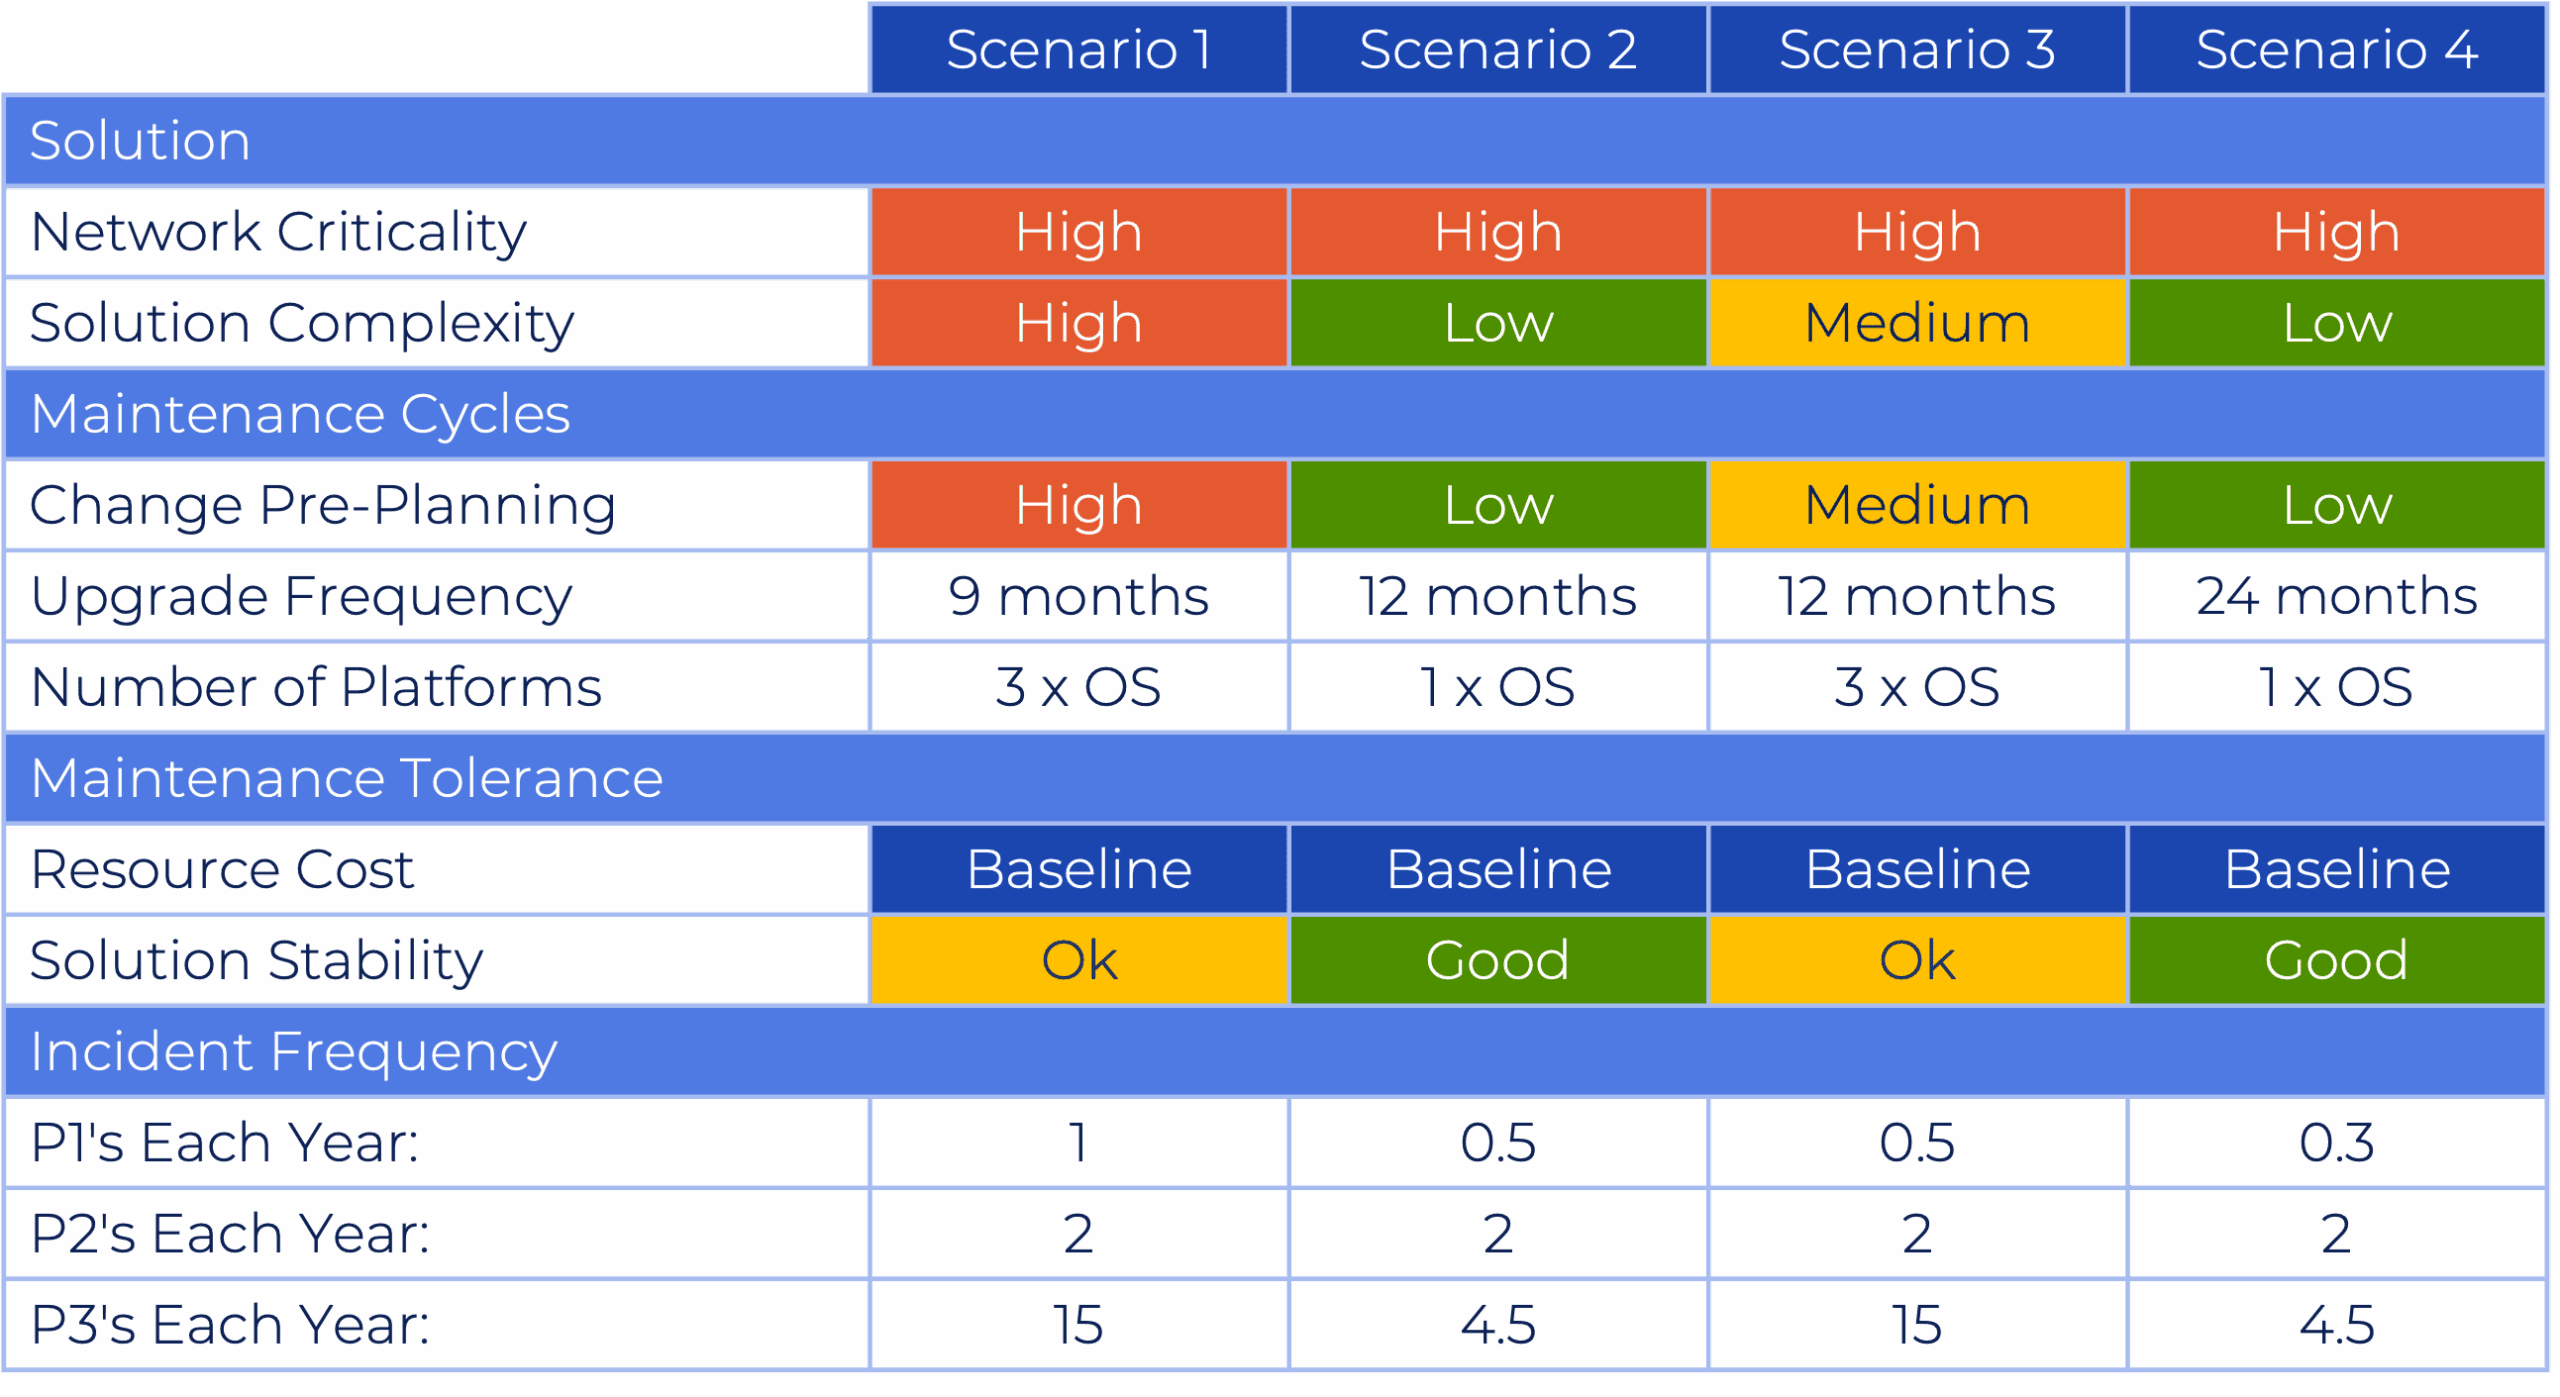
Once the inputs are defined, they’re imported into Netos Core and linked to scenario models within Netos Projects for analysis and comparison.
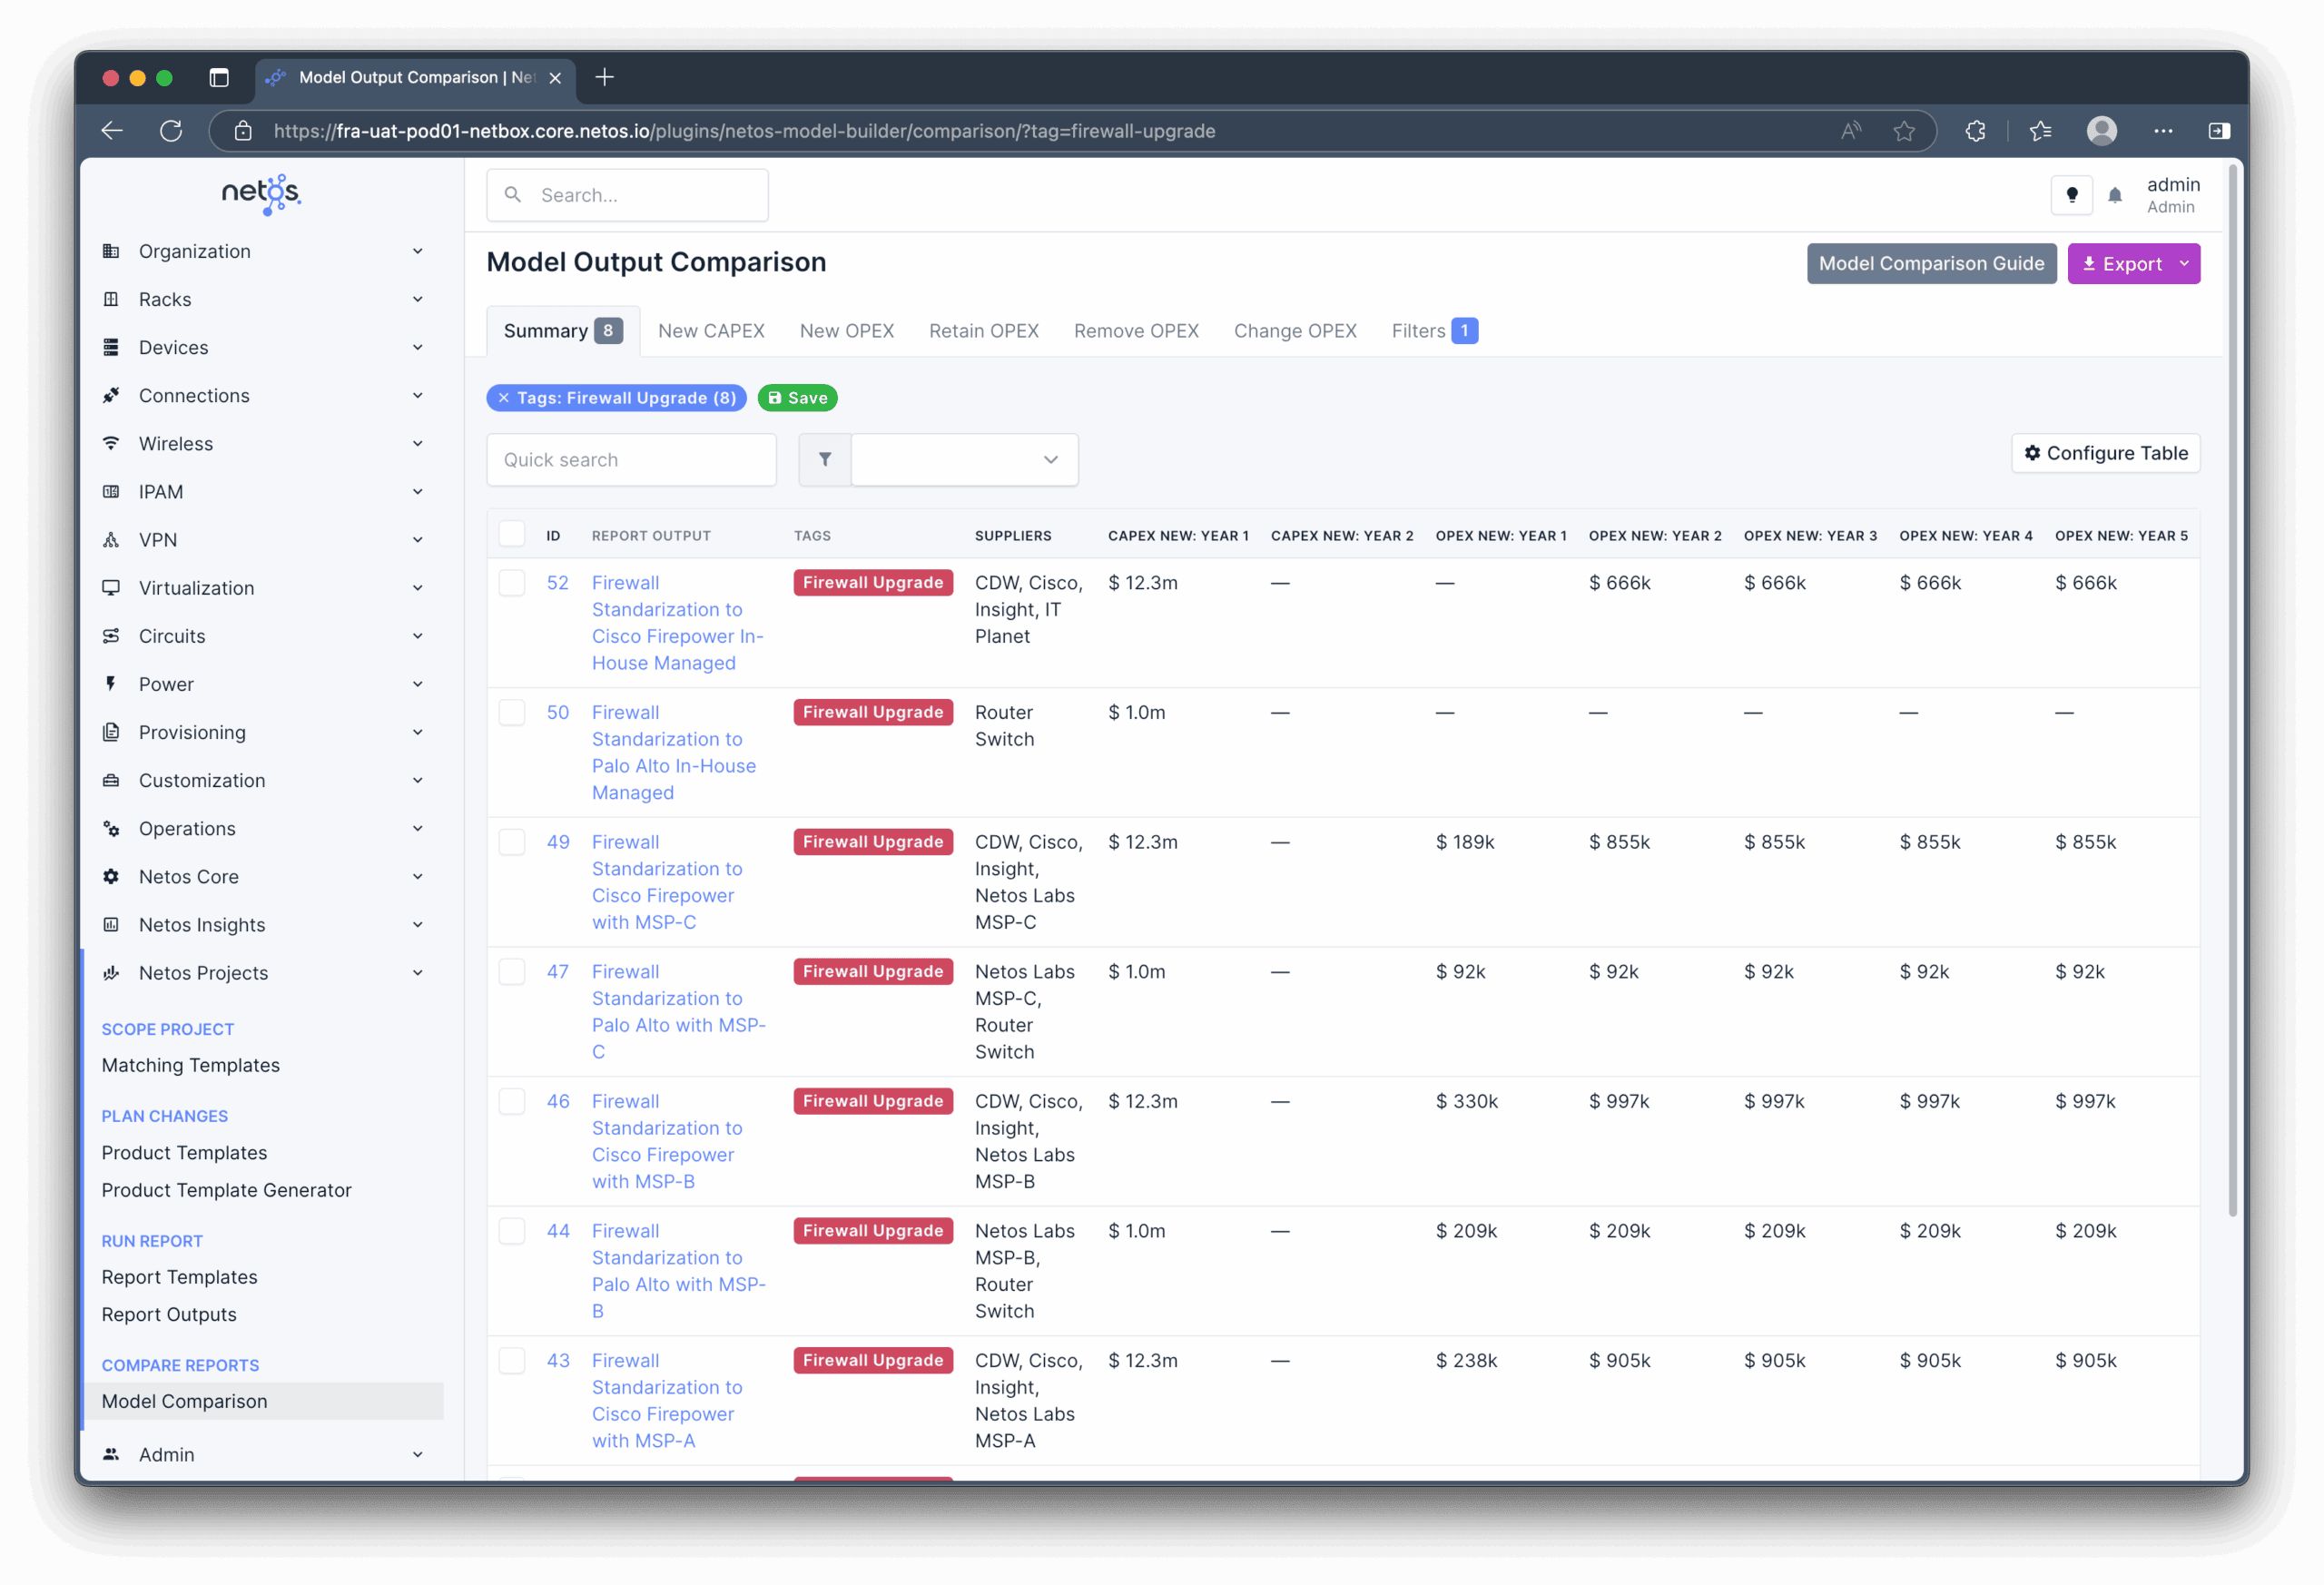
Example of project comparisons in Netos Projects
Building the Model
Using the advanced modeling capabilities within Netos Projects we leveraged:
- Product Templates – To map Bills of Materials (BoMs) and align pricing
- Matching Templates – To define and scope the existing and proposed solution
- Report Templates – To connect all inputs, run calculations, and generate outputs
This modular approach allows for repeatable, scalable scenario modeling across a wide range of environments and scenarios, even to model small cost changes at a macro level.
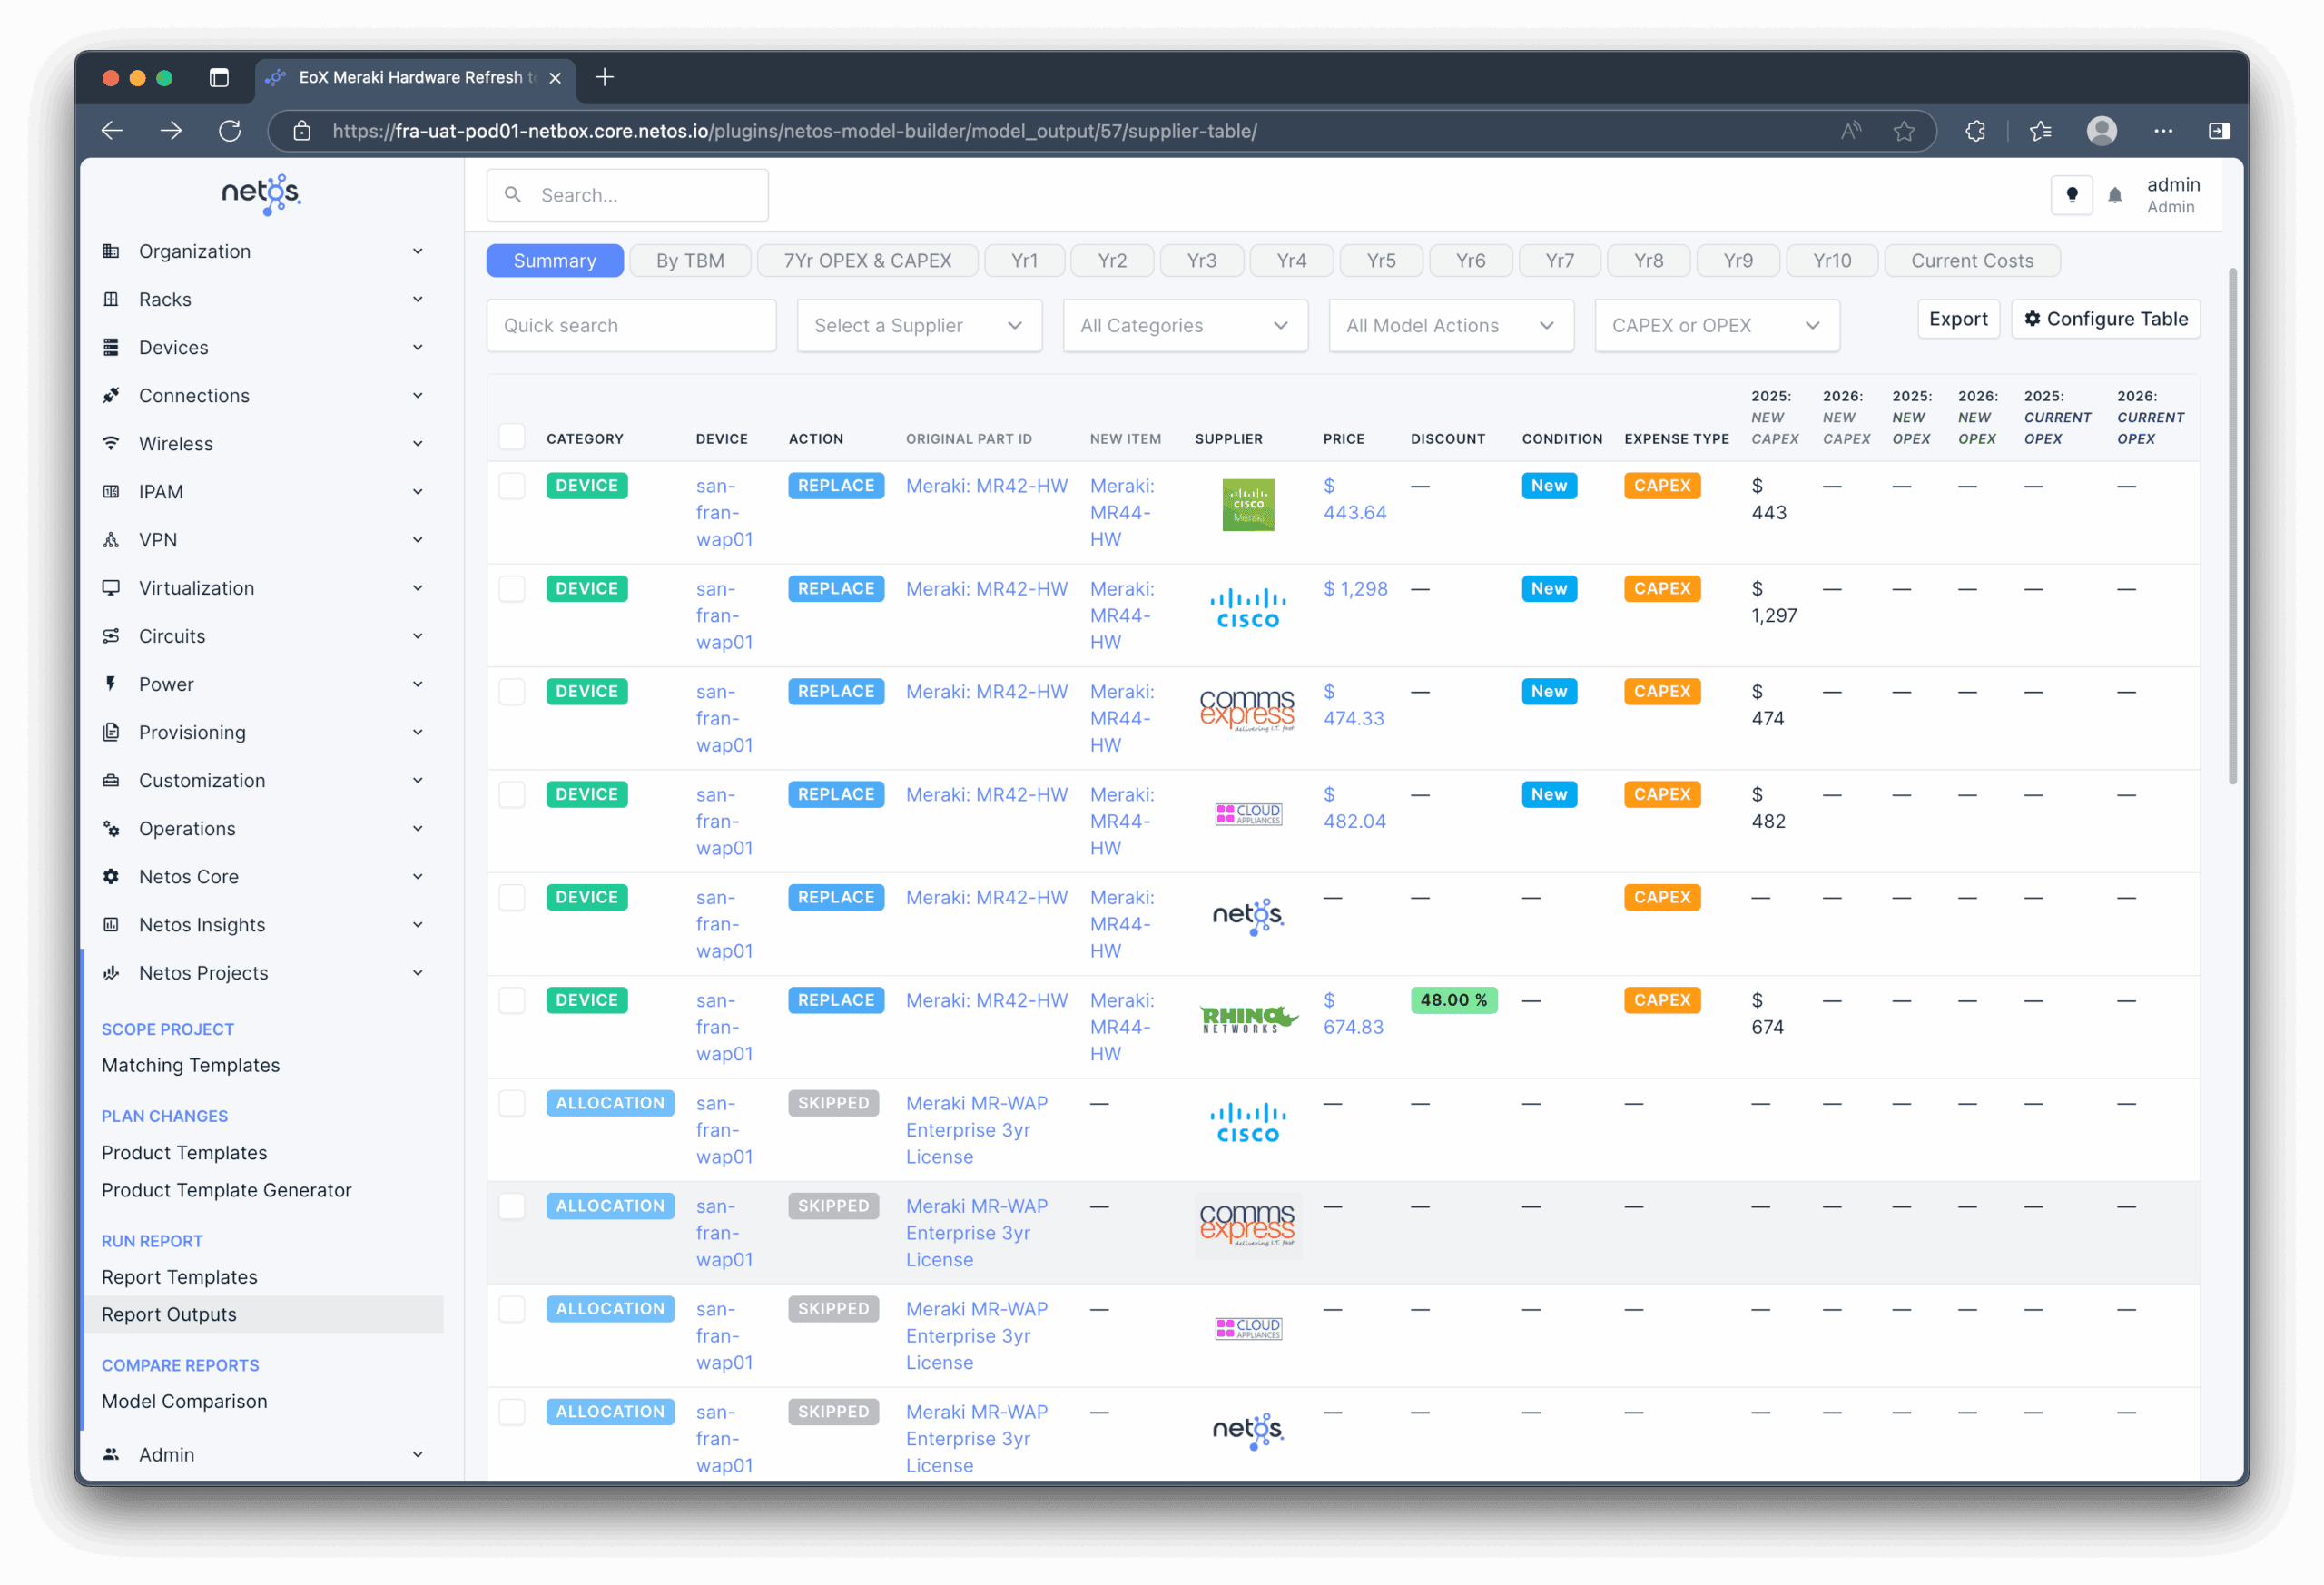
Example of cost comparisons in Netos Projects
Model Analysis
Following completion of the data import and analysis, in our case study for the UK bank:
- The new vendor delivered a 52% – 58% reduction in TCO vs. the incumbent
- This equated to up to $1M in savings over 5 years, in the baseline scenario
Key benefits of a lower TCO solution:
- Fewer, smoother upgrades reduce disruption and planning overhead
- Lower operational risk due to fewer software bugs and vulnerabilities
- Engineers shift focus from reactive support to strategic initiatives
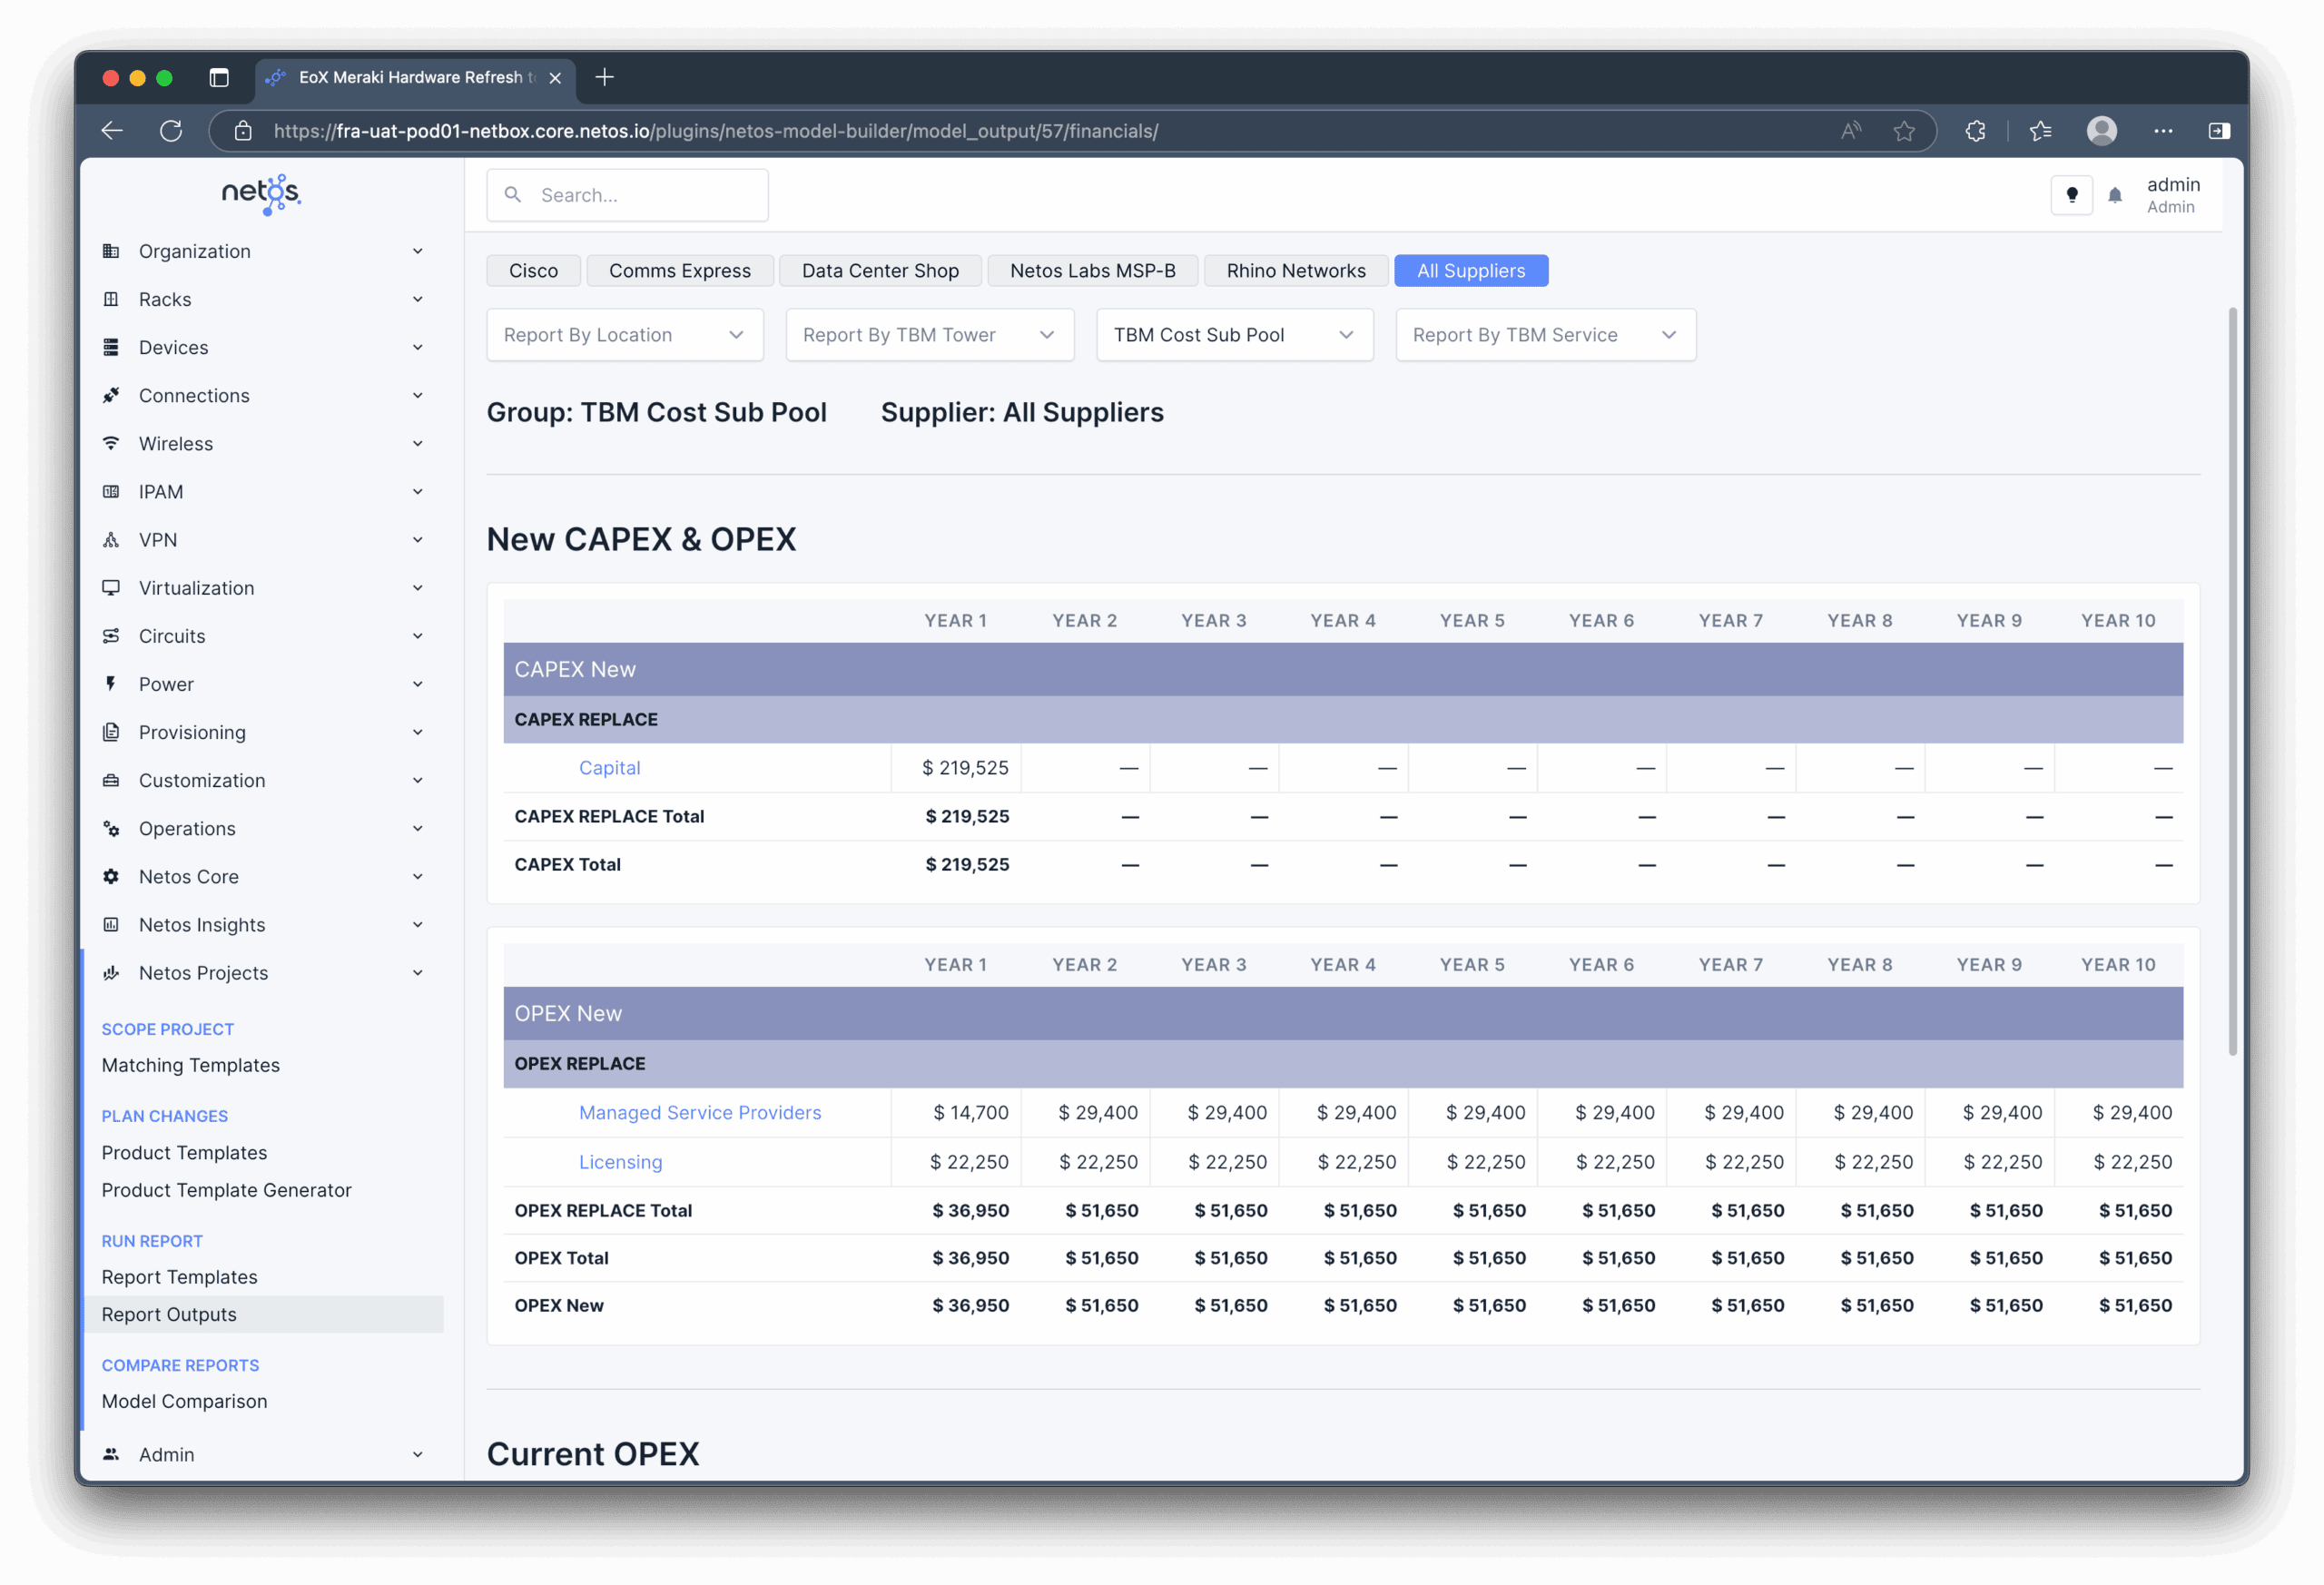
Example of Netos Projects Financial Summary
Conclusion
Total Cost of Ownership isn’t just a financial metric—it’s a window into how network complexity, change management, and operational resilience affect long-term value.
By combining structured inputs we’re able to build detailed TCO models in days, not months. These models help customers and vendors forecast risk, justify investment, and identify opportunities to reduce cost.
Our modeling approach draws on the following data and tools:
- Customer Data – Asset inventory, infrastructure scope, and project context
- Vendor BoMs – Bill of Materials, pricing, and alternative design/solution options
- Netos Core – Ingestion and normalization of customer and vendor data
- Netos TCO Framework – Customer scenarios and inputs for Netos Projects
- Netos Projects – Project and TCO models that support business case development and executive buy-in
Strategic TCO Considerations
In the TCO model outlined here, we focused on the cost of ownership for a new solution. But the same framework can be extended far beyond budgeting and form part of an ongoing FinOps for Networks solution, for example:
- Automation ROI – Whether automation reduces effort and lowers costs
- Licensing Models – Compare perpetual vs. subscription; CAPEX vs. OPEX
- Current Cost Benchmarking – Validate whether existing costs are excessive
- Energy Modelling – Factor in power usage and regional energy costs
- Vendor Comparison – Compare lifecycle costs, upgrade cycles, and support
- End-of-Life Planning – Model cost/risk of running unsupported networks
- Regulatory Impact – Include compliance and regional hosting requirements
- M&A / Outsourcing – Model costs post-merger or third-party shift
Next Steps
If you’re a customer or partner interested in learning more about Netos please get in contact to Schedule a Demo.